What's new

Forex News Daily Market Forecast By Capitalcore

5.00 star(s) 1 Vote
UK100 Technical Analysis Before Breakout

The UK100, commonly referred to as the FTSE 100 Index or simply the "Footsie", represents the 100 largest companies listed on the London Stock Exchange by market capitalization. It serves as a key benchmark for the performance of major UK equities and is often influenced by both domestic economic indicators and global market trends. In today's fundamental outlook, attention turns to three key economic metrics released by the Bank of England: money supply, mortgage approvals, and consumer credit. All three are forward-looking indicators tied closely to consumer and business confidence. If today's figures surpass expectations, it would suggest improved economic momentum, supporting the GBP and potentially fueling further upside in the FTSE 100 through stronger corporate earnings expectations. However, any disappointment in these data points may pressure sentiment and dampen near-term price action on the UK100 daily chart.

Chart Notes:
• Chart time-zone is UTC (+02:00)
• Candles’ time-frame is 4h.

From a technical perspective, the UK100 H4 chart reveals a classic symmetrical triangle pattern, indicating a period of consolidation following an earlier bullish move. Currently, the price is hovering near the ascending trendline support, suggesting a potential bounce—especially if it holds. A breakout above the descending resistance line could signal a continuation of the prior uptrend. The Parabolic SAR shows the last four dots forming below the candles, a bullish signal indicating potential upward momentum. The RSI (Relative Strength Index) sits at around 45.71, showing a neutral to slightly bearish stance, yet not oversold, leaving room for a rebound. Meanwhile, the MACD (Moving Average Convergence Divergence) shows a slight bearish crossover, indicating weakened momentum but not an aggressive downtrend. Traders should closely monitor the price reaction around the triangle's lower trendline and watch for a breakout confirmation in either direction on this UK100 H4 price action setup.

• DISCLAIMER: Please note that the above analysis is not an investment suggestion by “Capitalcore LLC”. This post has been published only for educational purposes.

Capitalcore
 
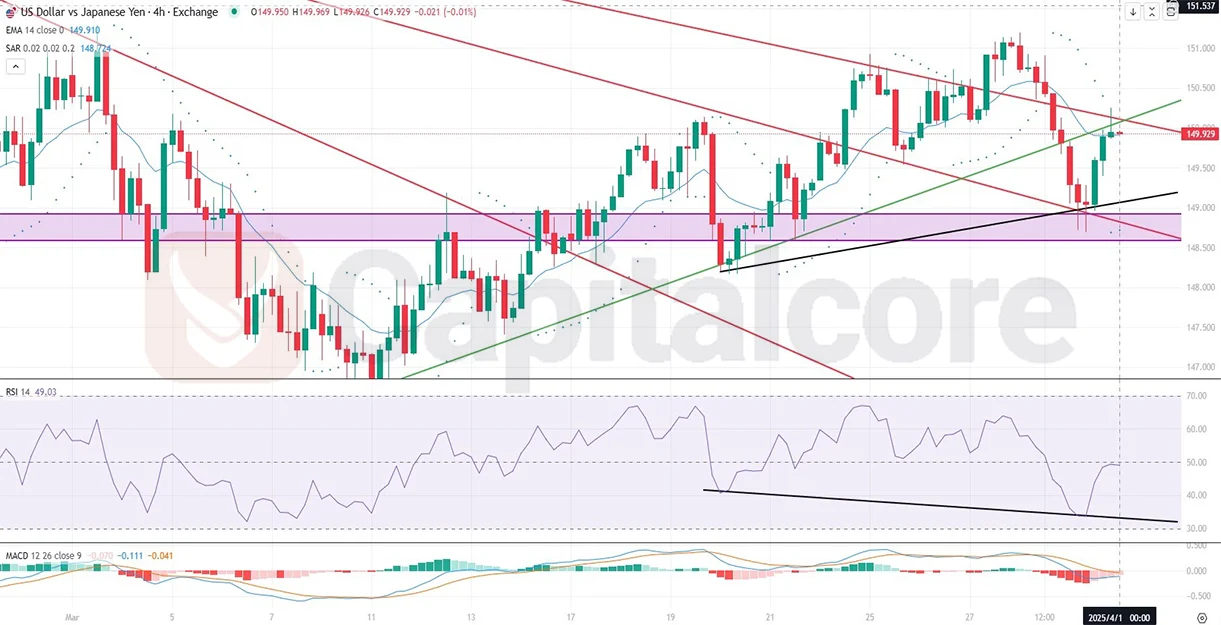
USD/JPY Daily Chart Analysis

The USDJPY forex pair, often referred to as the “Gopher” in trading circles, is a major currency pair representing the US dollar (USD) versus the Japanese yen (JPY). Known for its high liquidity and sensitivity to monetary policy and geopolitical developments, this pair offers rich opportunities for both technical and fundamental traders. Fundamentally, the USD-JPY is in focus today as markets await key comments from Federal Reserve Bank of Richmond President Thomas Barkin, which could shed light on future US interest rate moves. His tone—whether hawkish or dovish—may significantly impact the dollar. On the Japanese side, economic data like the Jobless Rate and the Tankan survey suggest subdued employment concerns but mixed industrial sentiment. While Japan's Tankan index indicates potential stagnation in manufacturing and services, upcoming US data such as ISM Manufacturing PMI, Construction Spending, and Consumer Confidence are expected to underscore a resilient US economy. Overall, expectations of stronger US macro data and possible hawkish Fed rhetoric give the greenback a fundamental edge in today’s USD JPY outlook, favoring a bullish bias unless data disappoints sharply.

Chart Notes:
• Chart time-zone is UTC (+03:00)
• Candles’ time-frame is 4h.

Technically, the USD/JPY 4-hour chart shows a complex battle between bullish and bearish forces. The pair is gradually breaking downtrend lines one by one, and only one major descending trendline remains to be cleared for a full bullish breakout confirmation. Although the price recently dipped below a key support zone and pulled back—suggesting a potential bearish continuation—the bounce strongly hints at a BOF (Breakout Failure), which aligns with the emergence of a possible bullish trend. This idea is supported by bullish divergence on the RSI, where price made lower lows while RSI printed higher lows, indicating waning bearish momentum. RSI is hovering near 50, signaling neutrality with potential for upward momentum. The MACD histogram is shrinking its bearish bars, and lines are close to a bullish crossover, reinforcing the upward scenario. Meanwhile, the Parabolic SAR still prints above the candles, indicating short-term bearish bias, but this can flip quickly if momentum continues. Watch for a breakout above the final trendline for confirmation of a sustained uptrend continuation in the USDJPY daily chart technical analysis.

• DISCLAIMER: Please note that the above analysis is not an investment suggestion by “Capitalcore LLC”. This post has been published only for educational purposes.

Capitalcore
 
EURUSD H4 Chart Forecast and Outlook

The EURUSD, often referred to as the "Fiber" in the forex market, represents the most heavily traded currency pair in the world, symbolizing the euro versus the U.S. dollar. As of today, market sentiment around EURUSD is highly sensitive to economic updates from both the Eurozone and the United States. European data releases, including a worse-than-expected French Government Budget Balance (-30.2B vs. -17.3B) and moderate improvement in Spanish Unemployment, slightly weigh on the euro. However, eyes are keenly on the U.S. session, with key market movers like the ADP Non-Farm Employment Change and Factory Orders in focus. If U.S. data continues to show mixed signals, especially weaker job numbers and declining factory orders, the dollar may face selling pressure, favoring a bullish continuation for EURUSD. Additionally, bond auction yields and evening speeches from U.S. policymakers, including former President Trump and FOMC member Kugler, could inject volatility into late trading sessions
EURUSD.jpg
Chart Notes:
• Chart time-zone is UTC (+02:00)
• Candles’ time-frame is 4h.

From a technical standpoint, the EURUSD H4 chart indicates a bullish structure. After a notable correction, the pair successfully broke above a descending trendline, signaling a potential shift back to the upside. Currently, the price is consolidating above a strong static support zone around 1.07500. RSI is bouncing from near-oversold levels, now heading upward around 44.65, suggesting growing bullish momentum. While the MACD histogram shows a slight bearish divergence, the signal lines are close to a potential crossover. Should MACD turn bullish and align with RSI’s direction, a fresh ascending wave on the EURUSD H4 chart would be strongly probable. This technical setup, combined with weaker U.S. fundamentals, sets the stage for a bullish price action scenario.

• DISCLAIMER: Please note that the above analysis is not an investment suggestion by “Capitalcore LLC”. This post has been published only for educational purposes.

Capitalcore
 
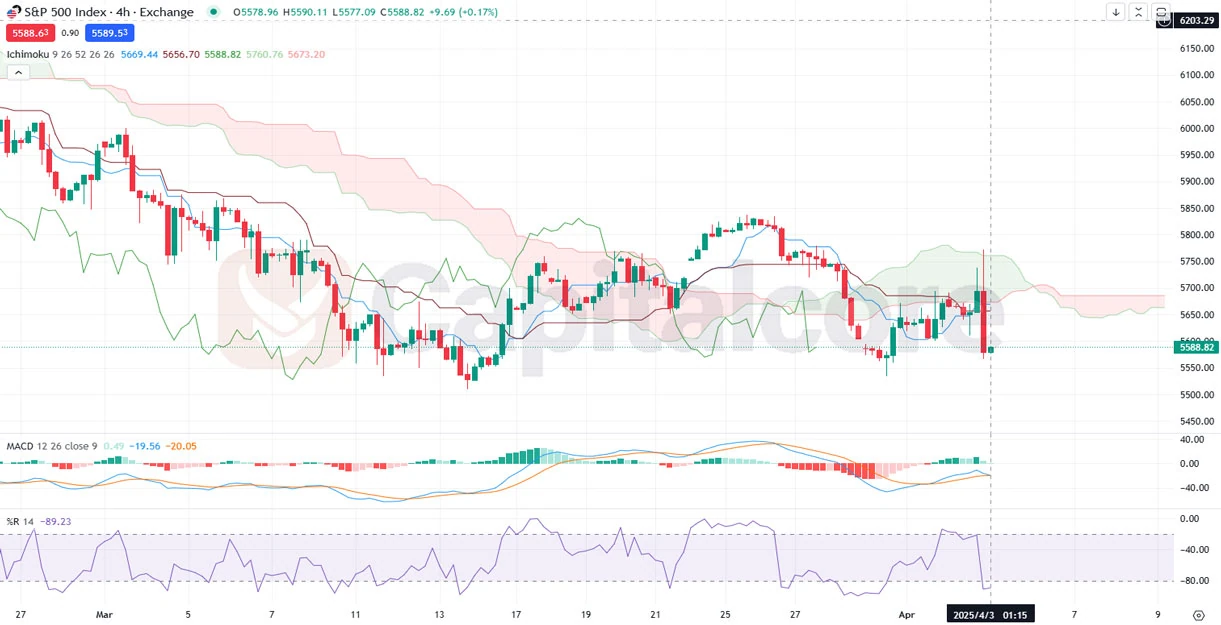
SP-500 Struggles To Break Ichimoku Cloud

The US500 (S&P 500), often called the “500,” serves as a benchmark for top-performing U.S. stocks and is pivotal for auging market sentiment in Futures Indices (CFDs). As traders monitor price action, today’s high-impact events—including a White House briefing on tariff policies, Federal Reserve speeches on inflation expectations, OPEC deliberations on oil output, and fresh jobless claims data—add layers of volatility to the US500 (S&P 500) daily chart technical and fundamental analysis. These developments could signal shifts in global trade relationships, future interest rate trajectories, and broader economic stability, making this session especially critical for short-term and long-term positioning.

Chart Notes:
• Chart time-zone is UTC (+03:00)
• Candles’ time-frame is 4h.

On the H4 chart, the US500 (S&P 500) has maintained a bearish trend below the Ichimoku Cloud, reflecting weaker price action in recent sessions. Although the index briefly tested the Cloud, it failed to break through and has since pulled back, with the Cloud itself remaining red but gradually thinning. The Cloud’s upper boundary is relatively flat, suggesting limited upward momentum, while MACD and Williams %R both point toward cautious sentiment. Taken together, this US500 (S&P 500) daily chart technical and fundamental analysis indicates that sellers still exert near-term control, though any bullish catalyst from today’s news could challenge the prevailing downward bias.

• DISCLAIMER: Please note that the above analysis is not an investment suggestion by “Capitalcore LLC”. This post has been published only for educational purposes.

Capitalcore
 
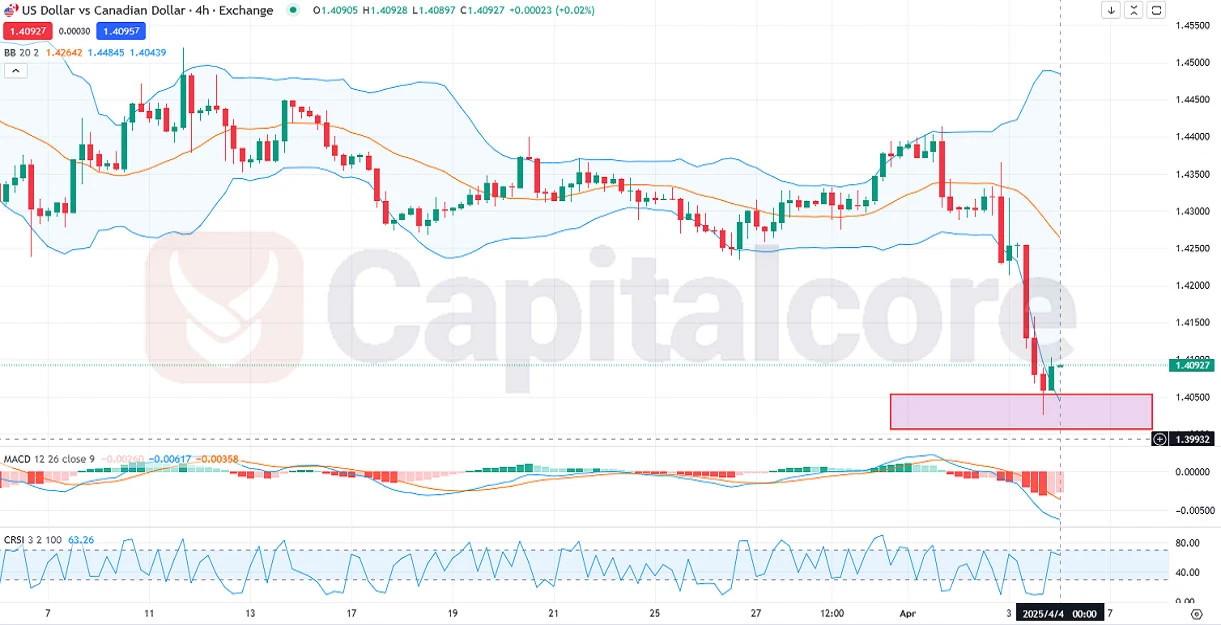
USDCAD H4 Price Action Analysis and Trading Strategy

The USD/CAD, often referred to by traders as the "Loonie", is a major forex pair that represents the exchange rate between the US Dollar and the Canadian Dollar. It is heavily influenced by oil prices, economic data from both the US and Canada, and monetary policy expectations.
Fundamentally, today's focus for the USDCAD forex pair is on key employment data from both countries. Canada is releasing its Employment Change and Unemployment Rate, crucial indicators of labor market health and consumer spending strength. Better-than-expected Canadian job data typically strengthens the CAD, putting pressure on USD CAD. On the US side, markets are closely watching the Non-Farm Payrolls (NFP) and Unemployment Rate, which are among the most impactful economic indicators for the USD. Additionally, several speeches from Federal Reserve officials, including Fed Chair Jerome Powell, could introduce volatility depending on the tone—hawkish commentary may strengthen the USD, while dovish remarks could weaken it. With both countries releasing critical labor data today, heightened volatility and strong directional moves are likely for the USD-CAD pair.

Chart Notes:
• Chart time-zone is UTC (+03:00)
• Candles’ time-frame is 4h.

Technically, as seen in the attached USDCAD H4 chart, the price has been in a clear bearish trend, with 9 out of the last 15 candles being red, confirming downward momentum. However, recent bullish candles show signs of a potential correction or reversal after the pair reached a key support zone highlighted in red. The price touched this support near 1.3993 and is now attempting a bounce. It's still in the lower half of the Bollinger Bands, indicating bearish pressure, but the latest candle shows a push toward the middle band, which may act as a near-term resistance. On the MACD, both the main line and the histogram are still in negative territory, but the histogram bars are fading in color (light red), which suggests decreasing bearish momentum. The Connor RSI (CRSI) is also pointing higher and currently sits above 60, signaling that short-term bullish pressure is building. If today's fundamental releases support the CAD, this bounce might be short-lived; otherwise, a breakout above the middle Bollinger Band could confirm a stronger corrective move.

• DISCLAIMER: Please note that the above analysis is not an investment suggestion by “Capitalcore LLC”. This post has been published only for educational purposes.

Capitalcore
 
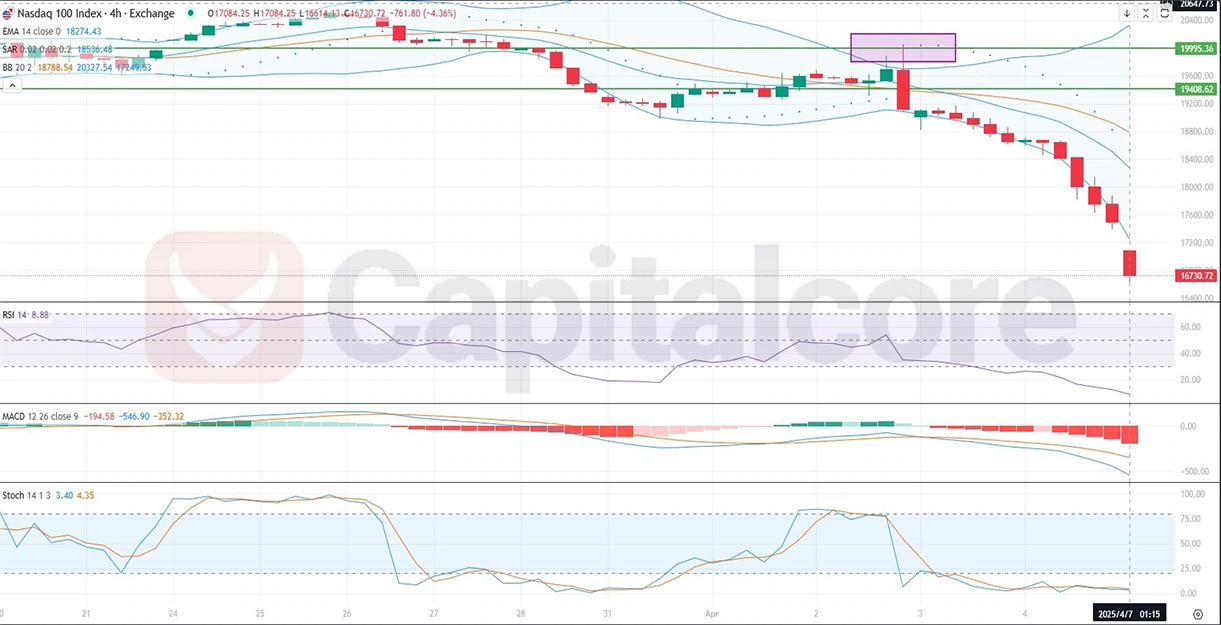
ND100 Daily Chart Technical Analysis

The Nasdaq 100 Index, often known by its nickname ND100, represents the top 100 non-financial companies traded on the NASDAQ exchange and is traded against the USD in forex markets. Fundamentally, today, traders' attention is focused on significant upcoming USD news involving the Federal Reserve Governor Adriana Kugler's speech on inflation dynamics and consumer credit figures. Hawkish comments from Governor Kugler, reflecting tighter monetary policy or indicating further rate hikes, would likely strengthen the USD, potentially exerting downward pressure on ND100. Conversely, a positive report on consumer credit could signal robust consumer spending, providing mild support for equities and potentially cushioning ND100's fall.

Chart Notes:
• Chart time-zone is UTC (+03:00)
• Candles’ time-frame is 4h.

From the technical perspective of the ND100 H4 chart, the price action clearly indicates bearish momentum. The price strongly broke its previous H4 support line, retested it briefly, and continued aggressively downward, effortlessly penetrating daily support. This sharp bearish movement is supported by multiple large-bodied red candles and a notable price gap between recent candles, underscoring traders' urgency to sell. Bollinger Bands are widening, suggesting heightened volatility and continuation of the bearish trend. The RSI, currently at an oversold extreme of 8.88, indicates strong bearish momentum but also hints at a potential short-term bounce due to overselling. MACD remains bearish, showing expanding negative histograms, confirming downward pressure. Stochastic indicators are deeply oversold, reinforcing the downward trend's strength but again cautioning of potential minor retracements. EMA 14 further emphasizes bearish sentiment as prices remain significantly below the moving average line.

• DISCLAIMER: Please note that the above analysis is not an investment suggestion by “Capitalcore LLC”. This post has been published only for educational purposes.

Capitalcore
 
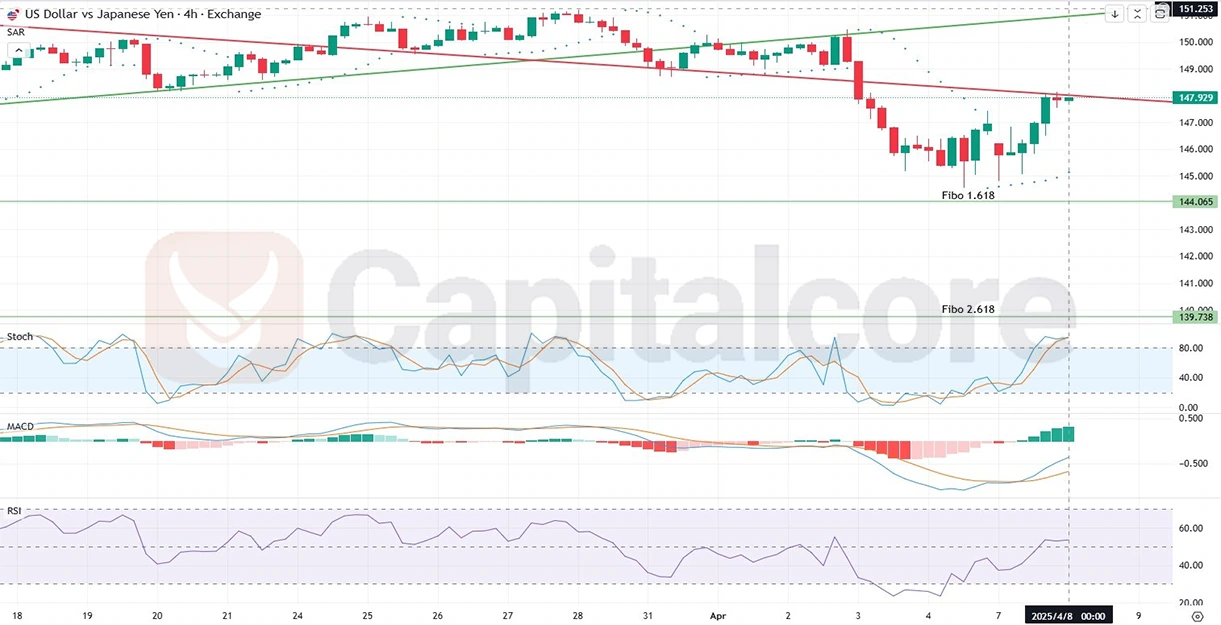
USD/JPY Forex Pair Price Action Targeting Fibonacci Levels

The USDJPY, widely known as the "Gopher," represents the currency pair of the United States Dollar (USD) against the Japanese Yen (JPY). As a highly liquid forex pair, it is closely monitored by traders globally due to its sensitivity to interest rate decisions, geopolitical events, and economic data releases. Today, traders will closely watch the Adjusted Current Account from Japan's Ministry of Finance and the Eco Watchers Current Index, both of which significantly impact market sentiment towards the Yen. A better-than-expected Current Account surplus or higher Eco Watchers Index could strengthen the JPY by signaling improved domestic economic conditions. Conversely, the USD faces potential volatility due to the NFIB Small Business Index and Fed President Mary Daly's discussion on the economic outlook and monetary policy, where any hawkish commentary could boost the USD.

Chart Notes:
• Chart time-zone is UTC (+03:00)
• Candles’ time-frame is 4h.

Technical analysis of the USD-JPY H4 chart indicates that the price action recently broke through two critical support lines and is currently retesting the second broken support, now acting as resistance at approximately 147.929. Should price action continue its bearish momentum, traders could anticipate targets at Fibonacci retracement levels of 1.618 at 144.065 and potentially 2.618 at 139.738. Parabolic SAR indicates bearish sentiment as the dots remain above the candlesticks, signifying downward pressure. MACD is showing diminishing bullish momentum, potentially signaling a bearish crossover, while the RSI is approaching overbought levels, suggesting possible exhaustion in the recent upward correction and supporting the likelihood of a reversal to the downside.

• DISCLAIMER: Please note that the above analysis is not an investment suggestion by “Capitalcore LLC”. This post has been published only for educational purposes.

Capitalcore
 
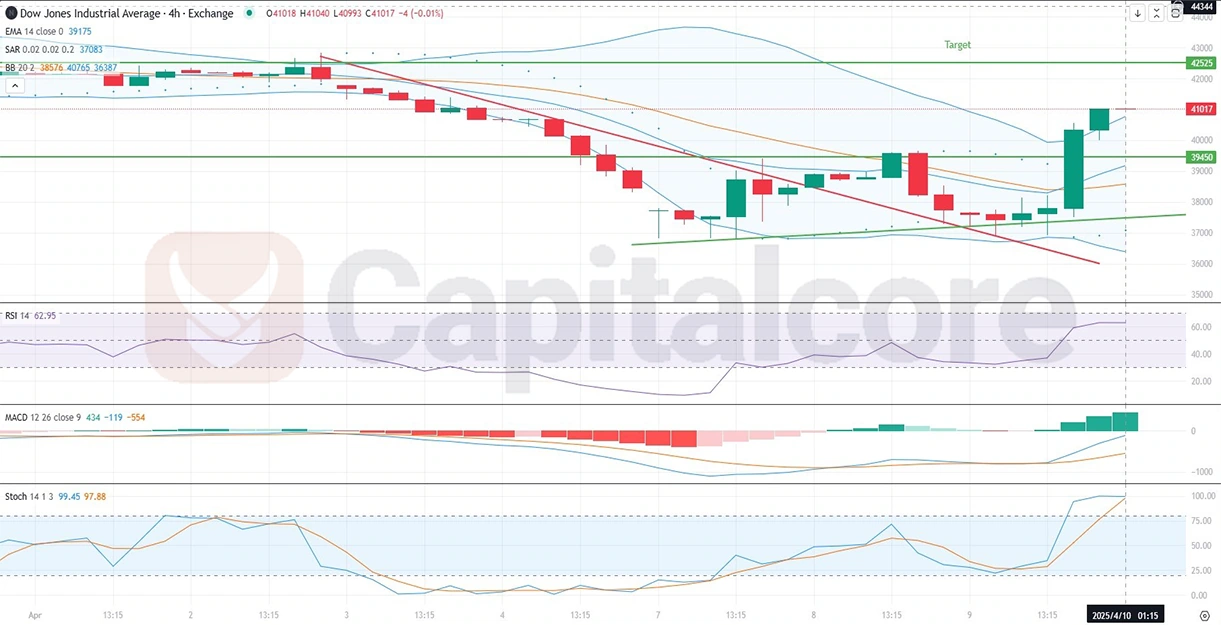
US30 Technical Analysis H4 Chart Today

The US30, also known as the Dow Jones Industrial Average or simply "Dow," represents 30 significant publicly traded US companies and is a critical indicator for overall US economic health. Today’s US fundamental outlook is shaped by several significant releases including the Core CPI and CPI, which are crucial indicators for inflation and monetary policy. A higher-than-forecasted CPI would likely strengthen the USD as markets anticipate further interest rate hikes by the Federal Reserve to control inflation. Additional attention will be on the Initial Jobless Claims and multiple Federal Reserve speakers, whose hawkish remarks could add further support for the USD. Overall, today's economic events could significantly impact US30 volatility and price action, especially if inflation data deviates from expectations or Fed speakers signal clear policy adjustments.

Chart Notes:
• Chart time-zone is UTC (+03:00)
• Candles’ time-frame is 4h.

Technical analysis of the US30 H4 chart indicates that the price has successfully broken the recent downtrend and experienced a pullback, confirming the transition into a new uptrend with two robust bullish candles. However, a corrective movement is likely necessary before continuing upwards. The immediate bullish target stands at approximately 42525, with potential correction support near 39450. Bollinger Bands are widening, suggesting increased volatility and potential upward continuation. The Parabolic SAR dots below the current candles confirm bullish momentum. The RSI at 62.95 points to upward momentum but remains below the overbought threshold, suggesting further upside potential. MACD shows increasing bullish momentum as indicated by the expanding histogram, and the Stochastic oscillator is currently in the overbought territory, signaling potential short-term correction before further advancement.

• DISCLAIMER: Please note that the above analysis is not an investment suggestion by “Capitalcore LLC”. This post has been published only for educational purposes.

Capitalcore
 
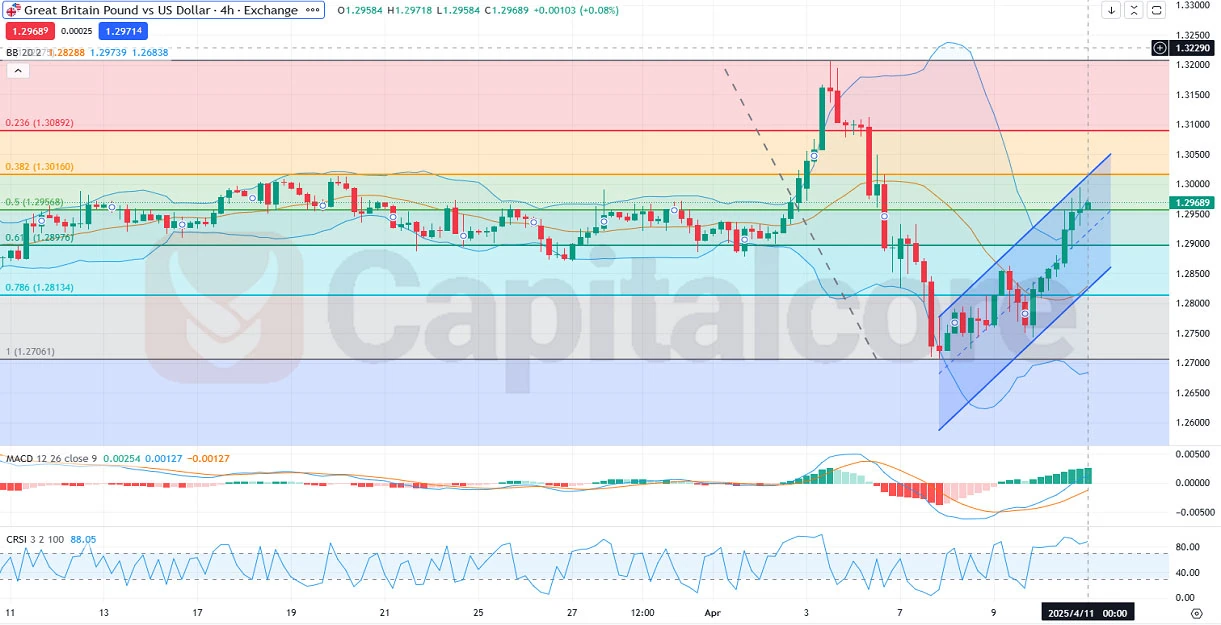
GBPUSD daily chart analysis and key resistance zones

The GBPUSD forex pair, commonly referred to by its nickname "Cable," represents the exchange rate between the British Pound Sterling and the US Dollar. It is one of the most liquid and widely traded currency pairs in the forex market, driven by key macroeconomic indicators and central bank policies from both the United Kingdom and the United States. On April 11, 2025, the GBPUSD is positioned ahead of several impactful fundamental events. For the USD, speeches from influential FOMC members such as John Williams and Alberto Musalem are expected to influence market sentiment, especially if the tone is more hawkish, hinting at future interest rate hikes. Additionally, the release of the University of Michigan Consumer Sentiment and Inflation Expectations, along with the PPI and Core PPI, will offer insight into inflationary trends and consumer outlook—key considerations for future Fed decisions. On the UK side, a slate of economic data including monthly GDP, manufacturing production, trade balance, and construction output is set to be released. These will provide a broader view of the UK economy’s performance. A stronger-than-expected showing could support further gains for the pound, especially if the US data signals slowing inflation or dovish undertones from Fed officials.

Chart Notes:
• Chart time-zone is UTC (+03:00)
• Candles’ time-frame is 4h.

Technically, the GBPUSD H4 chart shows strong bullish price action within a well-defined ascending channel. The last eight candlesticks have been consecutively bullish, pushing the price above the 1.29500 level and testing the 0.5 Fibonacci retracement level. With the current candle opening at this level, a successful breakout could target the 0.382 Fibonacci level near 1.30160. The Bollinger Bands indicate upward momentum, with the GBPUSD price hugging the upper band—a classic signal of bullish strength. The MACD shows growing bullish momentum, as both the MACD line and histogram rise above the signal line. Additionally, the Connors RSI (CRSI) is above 88, signaling strong buying pressure but also approaching potential overbought conditions. Overall, the technical outlook remains bullish in the short term, with 1.30160 and potentially 1.30890 as the next key resistance levels if fundamentals align.

• DISCLAIMER: Please note that the above analysis is not an investment suggestion by “Capitalcore LLC”. This post has been published only for educational purposes.

Capitalcore
 

Create an account or login to comment

You must be a member in order to leave a comment

Create account

Create an account on our community. It's easy!

Log in

Already have an account? Log in here.

Similar threads

Users Who Are Viewing This Thread (Total: 0, Members: 0, Guests: 0)

Top
AdBlock Detected

We get it, advertisements are annoying!

Sure, ad-blocking software does a great job at blocking ads, but it also blocks useful features of our website. For the best site experience please disable your AdBlocker.

I've Disabled AdBlock    No Thanks