What's new

Forex News Daily Analysis By FXGlory

4.70 star(s) 3 Votes
AUDUSD H4 Technical and Fundamental Analysis for 02.03.2025


AUDUSD-H4-technical-analysis---02.03.2025.jpg

Time Zone: GMT +2
Time Frame: 4 Hours (H4)


Fundamental Analysis:

The Australian Dollar (AUD) is currently facing downward pressure amid key economic data releases. The latest Melbourne Institute CPI report is expected to provide insights into consumer inflation, which directly impacts the Reserve Bank of Australia's (RBA) monetary policy stance. Meanwhile, Australian Retail Sales and ANZ Job Advertisements reports will give a clearer picture of consumer spending and employment trends. Any signs of weakening economic activity could lead to further AUD depreciation. On the USD side, the market is watching S&P Global and ISM Manufacturing PMI, which will provide a broad economic outlook for the United States. Strong manufacturing data could boost the USD, leading to further AUDUSD declines. Additionally, Federal Reserve official Raphael Bostic's speech might provide hints on future US interest rate policies, influencing market sentiment.


Price Action:
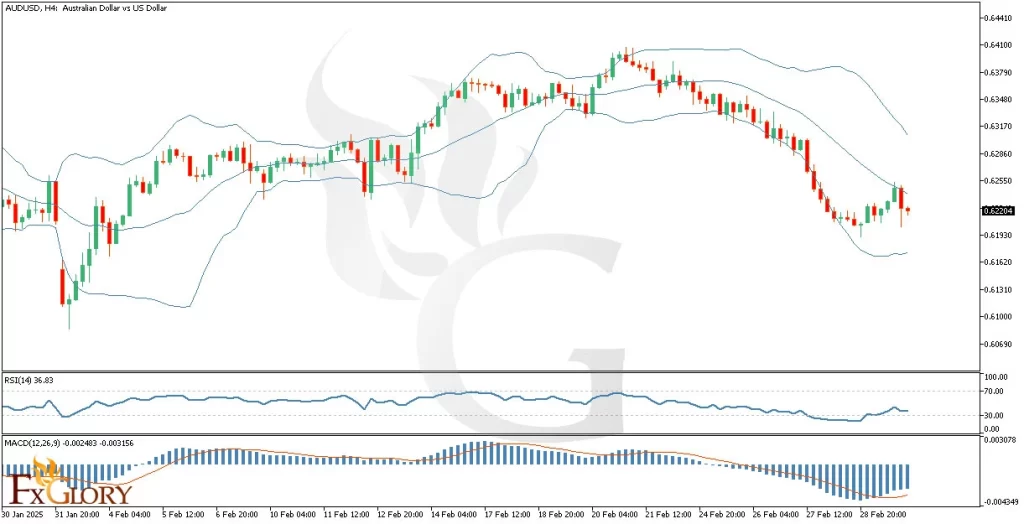
After the market opened, AUD/USD recorded a significant gap down, with price opening at a much lower level. The first few candles show two consecutive large red candles, indicating a strong bearish movement. This suggests increased selling pressure, likely fueled by fundamental catalysts favoring the USD. The price has broken below a key support zone, confirming strong bearish momentum.


Key Technical Indicators:
Ichimoku Cloud:
The AUDUSD price is trading well below the Ichimoku Cloud, indicating a strong bearish trend. The Tenkan-sen (red line) and Kijun-sen (blue line) have crossed downward, reinforcing the bearish sentiment. Additionally, the future cloud is turning red, suggesting continued downside pressure.
Relative Strength Index (RSI): The RSI is currently at 25.76, deep in the oversold territory. This signals that the AUD USD pair is experiencing extreme selling pressure. However, it also suggests that a potential short-term correction or bounce might occur if buyers step in.
Volume: There is a notable increase in volume, supporting the strong bearish move. The high trading volume confirms that sellers are dominant in the market. However, if volume starts declining, it could indicate exhaustion of the bearish trend.


Support and Resistance Levels:
Support:
Support level is seen around 0.6090, where price may stabilize; a break below could drive it toward 0.6050.
Resistance: Resistance level is near 0.6220, the previous breakdown level, with further resistance at 0.6285, aligning with the Ichimoku Cloud.


Conclusion and Consideration:

The AUDUSD H4 technical analysis indicates a strong bearish trend, supported by key technical indicators like Ichimoku Cloud, RSI, and Volume Analysis. Fundamentally, the strong USD data and weak AUD economic outlook are further driving the AUD-USD pair downward. While RSI suggests oversold conditions, the overall market sentiment remains bearish unless a significant catalyst reverses the trend. Traders should closely monitor upcoming Retail Sales and PMI data, which could introduce volatility. If economic data continues to favor the USD, further downside movement is likely. However, a technical bounce from oversold conditions is also possible.


Disclaimer: The analysis provided for AUD/USD is for informational purposes only and does not constitute investment advice. Traders are encouraged to perform their own analysis and research before making any trading decisions on AUDUSD. Market conditions can change quickly, so staying informed with the latest data is essential.


FXGlory
02.03.2025
 
NZDUSD H4 Technical and Fundamental Analysis for 02.04.2025


Time Zone: GMT +2
Time Frame: 4 Hours (H4)


Fundamental Analysis:

The NZD/USD forex pair is currently facing significant market influences, driven by both New Zealand and U.S. economic data releases. Today, key U.S. reports, including the JOLTS Job Openings (expected 8.01M, prior 8.10M) and Factory Orders m/m (-0.7% expected, previous -0.4%), will provide insight into the U.S. labor market and manufacturing sector. Additionally, speeches by FOMC members Bostic and Daly could impact USD sentiment, particularly if they hint at future monetary policy changes.
On the New Zealand side, the GDT Price Index (forecasted at 1.4%) and Employment Change q/q (-0.2% expected, prior -0.5%) will play a key role in determining NZD movement. The Unemployment Rate is expected to rise to 5.1% from 4.8%, indicating potential labor market weakness, which may add bearish pressure on the NZD. Given these factors, the NZDUSD fx pair could experience increased volatility, with a higher probability of USD strength dominating the market.


Price Action:
After a strong bearish trend, NZD/USD has attempted a retest of the lost support zone in the form of a bullish correction. The price is currently trading around 0.56100, which aligns with an immediate resistance level. If this level holds, the NZD-USD pair could resume its downward movement. The recent price action shows a series of lower highs and lower lows, reinforcing the bearish structure. A failure to break above 0.56570 would likely push the NZD USD pair toward lower support levels.


Key Technical Indicators:
Relative Strength Index (RSI):
The RSI is currently at 40, signaling a bearish trend. This indicates that sellers are in control, but there is still room for further downside before entering oversold territory. If the RSI drops below 30, it could suggest an oversold condition, potentially leading to a short-term reversal or consolidation.
Volume Indicator: The volume indicator is showing a positive reaction to the bearish phase, reinforcing the possibility of a continued downward trend. Increased selling volume suggests that bearish sentiment remains strong, reducing the likelihood of a sustained bullish correction.


Support and Resistance:
Support:
Immediate support levels are identified at 0.55430, 0.55160, and 0.55000. These levels could be considered as targets for the upcoming bearish wave.
Resistance: Resistance levels are located at 0.56100, 0.56570, and 0.57250. Any sustained break above these levels would invalidate the bearish scenario.


Conclusion and Consideration:
The NZD/USD pair remains in a bearish structure, supported by key technical indicators, including RSI, volume, and MACD. The recent price action suggests that the bearish correction phase could continue if resistance at 0.56100 holds. Upcoming economic events, particularly U.S. labor market data and New Zealand employment reports, will play a crucial role in determining short-term price action. Traders should closely monitor resistance and support levels for potential breakout or continuation signals.


Disclaimer: The analysis provided for NZD/USD is for informational purposes only and does not constitute investment advice. Traders are encouraged to perform their own analysis and research before making any trading decisions on NZDUSD. Market conditions can change quickly, so staying informed with the latest data is essential.


FXGlory
02.04.2025
 
EUR/USD H4 Technical and Fundamental Analysis


EURUSD_Fundamental_Technical_PriceAction_Analysis_02_05_2025_.png


Time Zone: GMT +2
Time Frame: 4 Hours (H4)


Fundamental Analysis:

The EUR/USD pair remains influenced by key economic events scheduled for today. On the USD side, multiple Federal Reserve (FOMC) members are set to speak, including Governor Philip Jefferson and Richmond Fed President Thomas Barkin. These speeches may provide insights into future monetary policy, which could impact the U.S. dollar’s strength. Additionally, the U.S. trade balance report and ISM Services PMI data are expected, adding further volatility to the market. For the EUR, upcoming Industrial Production and Services PMI reports are crucial for gauging economic strength within the Eurozone. A stronger-than-expected print may support the euro, while weaker data could extend the current bearish pressure on EUR/USD. Given the hawkish Fed expectations, the U.S. dollar could maintain its dominance unless there is a significant shift in tone from policymakers.


Price Action Analysis:
After a gap occurred, the price reacted to its support level at 1.02194, forming several doji candles, indicating market indecision. Following the gap closure, the price has broken the first resistance trendline and is now heading toward the second and third resistance levels. The price is currently moving within a descending channel, and a confirmed break above the next trendline resistance could shift the market structure towards a more bullish scenario.


Key Technical Indicators:
Alligator Trend Line:
The alligator lines are beginning to cross upwards, indicating a potential bullish trend. If the price sustains above this pattern, further upside movement could be confirmed.
RSI (Relative Strength Index): The RSI is currently at 53.39, suggesting neutral momentum. However, if it moves beyond 60, a stronger bullish bias may develop.


Support and Resistance Levels:
Support:
The nearest support level is positioned at 1.02194, which was previously tested during the price drop before the gap closure.
Resistance: The immediate resistance levels stand at 1.03768, which aligns with the broken trendline, followed by the next major resistance at 1.04500 and 1.05095, forming a descending channel's upper boundary.


Conclusion and Consideration:
The EUR/USD H4 chart analysis shows a potential shift towards bullish momentum after breaking the first descending resistance trendline. However, upcoming fundamental events, including Fed speeches and key economic data, could significantly impact price movements. Traders should monitor resistance levels closely, as a breakout above 1.03768 could confirm further upside potential. Meanwhile, a failure to sustain gains might lead to another test of support at 1.02194.


Disclaimer: The analysis provided for EUR/USD is for informational purposes only and does not constitute investment advice. Traders are encouraged to perform their own analysis and research before making any trading decisions on EURUSD. Market conditions can change quickly, so staying informed with the latest data is essential.


FXGlory
02.05.2025
 
USDCAD H4 Technical and Fundamental Analysis for 02.06.2025


USDCAD-H4-Technical-and-Fundamental-Analysis-for-02.06.2025.jpg

Time Zone: GMT +2
Time Frame: 4 Hours (H4)


Fundamental Analysis

The USDCAD currency pair is experiencing volatility due to key economic events today. The US Dollar (USD) is impacted by multiple speeches from FOMC members Michelle Bowman, Philip Jefferson, and Christopher Waller, which may provide monetary policy signals affecting market sentiment. If their comments are hawkish, the USD could strengthen, while dovish remarks may lead to USD weakness. Additionally, Initial Jobless Claims, Challenger Job Cuts, and Productivity Reports will offer insights into the US labor market, potentially adding further USD volatility. On the Canadian Dollar (CAD) side, the Ivey PMI report is crucial; a higher-than-expected reading could strengthen CAD, driving USDCAD lower, while a weak reading could weaken CAD, pushing USD CAD higher.


Price Action Analysis
The USDCAD H4 chart shows a sharp bearish trend, followed by a minor correction in the last five candles. Four of these candles are bullish but relatively small, indicating a weak recovery attempt. The USD/CAD Price has found support at 1.4280, leading to a slight bounce, but the lack of strong bullish momentum suggests that this is likely a temporary consolidation rather than a reversal. The downtrend remains intact, and unless buyers push above key resistance levels, further bearish pressure could emerge.


Key Technical Indicators
Moving Averages (MA 9 - Blue & MA 17 - Red):
The short-term MA (9) has crossed below the long-term MA (17), forming a bearish crossover, confirming a downtrend continuation signal. The moving averages are both sloping downward, reinforcing selling pressure. Despite the recent small bullish candles, the USD CAD price remains below both moving averages, meaning the bearish trend is still dominant unless price reclaims the moving averages.
Relative Strength Index (RSI 14): The RSI is at 41.82, signaling bearish sentiment but not yet oversold conditions. This suggests there is still room for further downside before the market reaches oversold territory. If the RSI remains below 50, bears remain in control, and a drop below 30 would indicate oversold conditions, potentially leading to a short-term reversal or consolidation.
Awesome Oscillator (AO): The AO is at -0.014, confirming that negative momentum is still dominant, although the histogram bars are shrinking, indicating a possible slowdown in bearish momentum. If AO turns positive, it could suggest a trend shift, but for now, the bearish trend remains intact.


Support and Resistance
Support:
Immediate support is located at 1.4280, which has acted as a bounce level in recent price action, and if broken, it could push the USD/CAD price further down.
Resistance: The first resistance level is 1.4385, which aligns with recent price rejections and the 9-period moving average, while the next major resistance level is 1.4440, corresponding to the previous breakdown zone. A break above this level would challenge the bearish scenario and indicate potential bullish momentum.


Conclusion and Considerations
The USDCAD H4 technical analysis suggests a bearish trend continuation, with the bearish moving average crossover, RSI below 50, and AO still negative reinforcing the downside bias. The recent minor bullish correction lacks strong momentum, indicating a possible continuation of the downtrend unless buyers push above key resistance levels. Upcoming fundamental news events, including Ivey PMI for CAD and FOMC speeches, could drive volatility, making it crucial to monitor USDCAD price reactions. Traders should watch for a breakout or rejection at resistance levels, while a break below 1.4280 could trigger further bearish movement. Proper risk management is crucial, given the upcoming news releases that may cause sharp price fluctuations.


Disclaimer: The analysis provided for USD/CAD is for informational purposes only and does not constitute investment advice. Traders are encouraged to perform their own analysis and research before making any trading decisions on USDCAD. Market conditions can change quickly, so staying informed with the latest data is essential.


FXGlory
02.06.2025
 
GBPUSD H4 Technical and Fundamental Analysis for 02.07.2025


Time Zone: GMT +2
Time Frame: 4 Hours (H4)


Fundamental Analysis:

The GBP/USD currency pair remains highly reactive to economic events from both the UK and the US. Today, key market-moving events include speeches from BOE Governor Andrew Bailey and BOE Chief Economist Huw Pill, which could provide insights into future monetary policy. Traders will be watching for any hawkish or dovish tones that could impact the British Pound’s direction. On the USD side, multiple Federal Reserve officials, including Mary Daly, Lorie Logan, and Michelle Bowman, are scheduled to speak. Their commentary on monetary policy, inflation trends, and labor market conditions will be crucial, especially given upcoming Non-Farm Payroll (NFP) data and unemployment figures. If the Fed officials express concerns about inflation persistence, it may strengthen the USD, leading to further downside for GBP-USD.


Price Action:
The GBP/USD pair is showing a bearish bias on the H4 timeframe. Out of the last 10 candlesticks, 8 have been bearish, reflecting strong selling pressure. The GBPUSD price recently tested the Bollinger Bands lower band, bounced toward the middle band near the 50% Fibonacci retracement level, but failed to break higher. The rejection at the middle band signals that sellers remain dominant, pushing the price back toward the 38.2% Fibonacci retracement level, which aligns with the lower Bollinger Band. A further break below this key area could send the cable toward the 23.6% Fibonacci level, indicating a continuation of the bearish trend.


Key Technical Indicators:
Bollinger Bands:
The bands were wide over the past 24 hours, signaling high volatility, but have now started to tighten slightly, which could indicate an upcoming consolidation before another move. Price action suggests a bearish structure, as the price rejected the middle band and is now gravitating toward the lower band near the 38.2% Fibonacci level.
Relative Strength Index (RSI): The RSI is currently at 48.26, hovering near the neutral zone. This suggests that the market is neither oversold nor overbought, allowing room for further price action. However, the declining RSI trend reflects increasing bearish momentum.
Volumes: Recent volume spikes indicate strong market participation, particularly during downward moves. The last large bearish candle had a significant volume increase, suggesting that sellers are still in control. If volume remains high on further price drops, this would reinforce bearish momentum.


Support and Resistance Levels:
Support:
Immediate support is at 1.2307 (38.2% Fibonacci retracement). A break below could push GBPUSD toward 1.2260 (23.6% Fibonacci and recent lows), reinforcing bearish momentum.
Resistance: The first resistance is 1.2480 - 1.2570 (61.8% Fibonacci and previous rejections). A breakout could challenge 1.2500 (psychological level and middle Bollinger Band), signaling a potential shift in momentum.


Conclusion and Consideration:
The GBP/USD pair on the H4 timeframe continues to exhibit bearish price action, struggling to hold above key support levels. The rejection at the middle Bollinger Band and 50% Fibonacci level suggests further downside potential, with the next key target at 1.2307 and possibly 1.2260 if selling pressure persists. Fundamentally, the BOE speeches today could introduce volatility, while Fed speakers may reinforce USD strength, further pressuring the GBP USD pair. Traders should closely monitor upcoming market events and consider risk management strategies in case of sudden cable price spikes.


Disclaimer: The analysis provided for GBP/USD is for informational purposes only and does not constitute investment advice. Traders are encouraged to perform their own analysis and research before making any trading decisions on GBPUSD. Market conditions can change quickly, so staying informed with the latest data is essential.


FXGlory
02.07.2025
 
GOLDUSD H4 Technical and Fundamental Analysis for 02.10.2025


Time Zone: GMT +2
Time Frame: 4 Hours (H4)


Fundamental Analysis

The price of Gold (XAU/USD) remains highly sensitive to macroeconomic conditions and upcoming fundamental data releases. Today, the market is closely watching the Survey of Firms' Inflation Expectations from the Federal Reserve Bank of Cleveland. If inflation expectations rise, it could signal potential hawkish monetary policy from the Fed, strengthening the USD and pressuring Gold prices. Conversely, lower inflation expectations may support Gold as an inflation hedge. Additionally, broader market sentiment around interest rate decisions and geopolitical risks could drive gold price action. Investors will also monitor the US Dollar Index (DXY) for signs of strength or weakness, influencing Gold’s movement.


Price Action
Gold has been in a strong uptrend, continuously making new all-time highs over the past few weeks. However, after failing to break the previous ATH, the price action has formed a double-top reversal pattern, suggesting potential downside correction before a continuation of the bullish move. The last red candlestick with a long lower wick indicates strong rejection at the ATH level, reinforcing a temporary pullback. The first support level is the ascending trendline (green), and if the correction continues, the second support level lies around 2830. If the price finds strong demand at these levels, the bullish structure may resume, aiming for new all-time highs.


Key Technical Indicators
Parabolic SAR:
The last three Parabolic SAR dots are positioned below the price, confirming that the bullish trend remains intact. However, a shift in position above the price would indicate a potential trend reversal.
Bollinger Bands: Gold is currently supported by the middle Bollinger Band (20-period moving average). If the price continues to correct lower, it may test the lower Bollinger Band, acting as dynamic support. If the price rebounds from the middle band, the uptrend remains valid.
RSI (Relative Strength Index): The RSI is currently at 62.48, still below the overbought threshold (70). This indicates that Gold has room for further upside, but a break below 50 could suggest increasing bearish momentum.
MACD (Moving Average Convergence Divergence): The MACD line is above the signal line, indicating a bullish momentum; however, the histogram shows weakening bullish strength, suggesting a potential consolidation or correction before another upward movement.
%R (Williams %R): The %R indicator is currently at -37.17, which is close to the overbought zone but still within neutral territory. If the value moves further downward, it may indicate a potential short-term correction.


Support and Resistance Levels
support:
Immediate support is located at 2854 (green ascending trendline). If broken, the next key level is at 2830, a recent demand zone.
Resistance: Major resistance remains at 2871, which aligns with the last all-time high. A breakout above this level could lead to new record highs, pushing Gold towards 2900 and beyond.


Conclusion and Considerations
Gold’s overall trend remains bullish, but the formation of a double-top pattern suggests that a short-term pullback is likely before another leg higher. Traders should watch the key support zones at 2854 and 2830, as a bounce from these areas could indicate a continuation of the uptrend. Meanwhile, breaking below these levels might trigger further correction. The RSI, MACD, and Parabolic SAR confirm that bullish momentum is still present, but some caution is warranted due to weakening momentum signals. The upcoming Survey of Firms' Inflation Expectations could influence the USD, thereby impacting Gold prices. If the report suggests higher inflation expectations, USD strength could push Gold lower, whereas weaker expectations could support Gold’s rally.


Disclaimer: The analysis provided for XAU/USD is for informational purposes only and does not constitute investment advice. Traders are encouraged to perform their own analysis and research before making any trading decisions on XAUUSD. Market conditions can change quickly, so staying informed with the latest data is essential.


FXGlory
02.10.2025
 
USDJPY H4 Technical and Fundamental Analysis for 02.11.2025


Time Zone: GMT +2
Time Frame: 4 Hours (H4)


Fundamental Analysis:

The USD/JPY currency pair is influenced by the current market sentiment, economic data, and central bank policies. Today, the Japanese Yen (JPY) is expected to have low liquidity due to a Bank Holiday in Japan. This could lead to reduced volatility in the early session. However, significant movement is anticipated later due to multiple speeches from U.S. Federal Reserve (Fed) officials, including Fed Chair Jerome Powell's testimony at 5:00 PM GMT+2. PowellÂ’s comments will likely provide insights into future interest rate decisions, which could lead to increased volatility in USD-related pairs. Additionally, FOMC Members Hammack, Bowman, and Williams will speak later, adding to potential market fluctuations. Traders should closely monitor these events, as any hawkish or dovish remarks could drive significant price action in USDJPY.


Price Action:
The USDJPY H4 chart shows a bearish trend over the past several days. The pair recently started a weak correction phase, attempting to retrace some of its losses. The USD JPY price today is hovering near the lower Bollinger Band, indicating that selling pressure is still strong but also hinting at a possible short-term rebound. If the correction gains momentum, a test of key resistance levels is possible. However, a failure to hold recent gains could see the USD JPY pair continue its downtrend.


Key Technical Indicators:
Bollinger Bands:
The price is near the lower Bollinger Band, signaling that the market is in a bearish trend but also suggesting a potential short-term correction. If the USD/JPY price fails to break above the middle band, the downtrend is likely to resume.
Volume Indicator: The volume is also in a bearish trend, confirming that selling pressure remains dominant. However, there are signs that the volume may be decreasing, indicating a potential end to the correction phase soon.
Relative Strength Index (RSI): The RSI is currently at 42.00, which means the USD-JPY is not yet in the oversold zone (below 30). This suggests that there is still room for further downside, but a potential reversal could be near if RSI moves lower and approaches oversold conditions.


Support and Resistance:
Support:
Immediate support levels are identified at 150.000, 149.300, and148.500. These levels could be considered as targets for the upcoming bearish wave.
Resistance: Resistance levels are located at 152.500, 153.000, and 153.800. Any sustained break above these levels would invalidate the bearish scenario.


Conclusion and Consideration:
The USDJPY H4 analysis suggests that the pair is still in a bearish phase, but a short-term correction is underway. The Bollinger Bands, RSI, and Volume indicators indicate that while selling pressure remains strong, a temporary rebound is possible. However, todayÂ’s Fed Chair PowellÂ’s speech at 5:00 PM GMT+2 and other FOMC membersÂ’ speeches could significantly impact the USD, leading to sharp price movements. Given the low liquidity from the JPY side due to the Bank Holiday, traders should be cautious of sudden volatility spikes. Traders should monitor key support and resistance levels closely and adjust their trading strategies based on upcoming Fed comments. A break below 150.750 could extend the downtrend, while a push above 152.500 might signal a stronger recovery.


Disclaimer: The analysis provided for USD/JPY is for informational purposes only and does not constitute investment advice. Traders are encouraged to perform their own analysis and research before making any trading decisions on USDJPY. Market conditions can change quickly, so staying informed with the latest data is essential.


FXGlory
02.11.2025
 
USDCAD H4 Technical and Fundamental Chart Daily Analysis for 02.12.2025


USDCAD_H4_technical_fundamental_Sentimental_Analysis_20_12_2025.png

Time Zone: GMT +2
Time Frame: 4 Hours (H4)


Fundamental Analysis:

The USDCAD currency pair may see heightened volatility today and in the coming sessions due to a series of scheduled US and Canadian economic events. On the US side, traders will look closely at upcoming Consumer Price Index (CPI) releases on March 12, 2025, as well as comments from Federal Reserve Chair Jerome Powell and other FOMC members, which can offer critical clues on the US interest rate path. Meanwhile, the Canadian Dollar (CAD) could react significantly to the Bank of Canada (BOC) Minutes release set for March 26, 2025, and crude oil inventory reports given Canada’s sizable energy sector. These factors, combined with ongoing market sentiment around inflation and economic growth, may create a catalyst for a new price direction on the USD-CAD H4 chart.


Price Action:
The USD/CAD chart shows that the pair has been stuck for quite some time in a range channel (as indicated by the two blue horizontal lines). A recent breakout attempt above the channel failed, and price action has since retested the lower boundary twice, hinting at building downside pressure. The red cycle line visible on the chart suggests the timing for a new directional move may be near, and the formation of consecutive bearish candles signals a rising possibility of a sustained break below the channel support. Traders should monitor how the pair behaves around this critical zone, as a confirmed break could trigger a fresh downward trend.


Key Technical Indicators:
Bollinger Bands:
The three Bollinger Bands on the USD-CAD chart (the moving average center line, plus the upper and lower standard deviation lines) have converged closer together, indicating a period of lower volatility. Such tightening bands frequently precede a breakout move, highlighting the potential for a strong price action shift once volatility returns. The price has gravitated near the lower Band in recent sessions, reflecting a growing bearish bias. This contraction phase can end abruptly if the pair breaks convincingly below the channel support.
Parabolic SAR: The last three Parabolic SAR dots have formed above the most recent candles, illustrating that downside momentum is beginning to dominate. When the dots remain above price bars, it typically suggests a short-term downtrend. A continuation of this pattern will reinforce bearish sentiment and further align with the notion of a pending channel breakdown. Traders often look for price and Parabolic SAR alignment to confirm momentum direction.
RSI (Relative Strength Index): The RSI reading near 39 indicates that momentum is leaning to the downside without having reached oversold territory yet. An RSI below 50 generally reflects a bearish outlook, though there is still room for additional selling pressure before oversold conditions emerge. If RSI continues to drop, it could validate increased bearish control. Conversely, a move back above 50 might signal a swing in momentum favoring buyers.


Support and Resistance:
Support:
Immediate support rests around the 1.4230 level, the lower boundary of the established price channel. A decisive close below this threshold could open the door toward the 1.4100 mark, which stands as the next notable support.
Resistance: Key resistance is observed near 1.4450, aligning with the channel’s upper boundary. An additional resistance hurdle waits around 1.4700, which coincides with prior swing highs and could test bullish commitments if price surges upward.


Conclusion and Consideration:
The USD Vs. CAD pair appears poised for a potential breakout from its prolonged consolidation, and current technical indicators skew bearish. While a downside break remains likely given the failed attempt to breach the channel top and repeated tests of the lower boundary, major fundamental releases—such as US CPI and BOC Minutes—could inject sudden volatility and shift momentum. Traders conducting a technical and fundamental chart daily analysis for USDCAD should monitor both the market’s reaction to upcoming news and the price action around critical support and resistance levels. Caution and diligent risk management remain key, especially if a definitive channel break to the downside materializes.


Disclaimer: The analysis provided for USD/CAD is for informational purposes only and does not constitute investment advice. Traders are encouraged to perform their own analysis and research before making any trading decisions on USDCAD. Market conditions can change quickly, so staying informed with the latest data is essential.


FXGlory
02.12.2025
 
GBPUSD H4 Technical and Fundamental Analysis for 02.13.2025


GBPUSD-H4-Techniacal-and-Fundamental-Analysis-for-02.13.2025.jpg

Time Zone: GMT +2
Time Frame: 4 Hours (H4)


Fundamental Analysis:

The GBPUSD pair is poised for volatility due to several key economic releases today. For the British Pound (GBP), the RICS Housing Price Balance report could influence market sentiment as it serves as an early indicator of housing inflation trends. Additionally, upcoming GDP, Construction Output, Trade Balance, and Industrial Production reports in the following days will further shape market expectations regarding the UK economy.
On the US Dollar (USD) side, a press conference by US President Donald Trump and a speech by Federal Reserve Governor Christopher Waller about stablecoins could introduce significant market movement. Additionally, US Producer Price Index (PPI) data is scheduled, serving as a leading indicator of inflation. The combination of UK economic reports and US policy discussions may drive volatility in the GBPUSD pair, making price action highly reactive to today’s scheduled events.


Price Action:
On the GBPUSD H4 chart, the price has been fluctuating between Fibonacci retracement levels, indicating a mix of bullish and bearish pressure. Recently, a bullish recovery has been observed as the GBP/USD price approaches a key resistance level. The market sentiment suggests buyers are attempting to push the price higher, though a strong breakout is required to confirm further upside momentum. Candlestick formations suggest increased volatility, with recent wicks showing both buying and selling pressure.


Key Technical Indicators:
Bollinger Bands:
The price recently touched the upper Bollinger Band and pulled back slightly, suggesting resistance at this level. Currently, the price is once again moving closer to the upper band, indicating a potential continuation of the bullish momentum. If the GBP USD price breaks above the band with high volume, it could signal an expansion in volatility and further upside movement.
Parabolic SAR: The Parabolic SAR dots (aqua-colored) are positioned below the candles, indicating an ongoing bullish trend. The consecutive SAR dots below price action provide confirmation that buyers are in control. However, if the dots shift above the GBP-USD price, it may signal a reversal or a period of consolidation.
MACD (Moving Average Convergence Divergence): The MACD histogram is currently positive, indicating bullish momentum. The MACD line is above the signal line, suggesting continued upward pressure. However, the momentum appears moderate, meaning traders should monitor for any signs of divergence or a bearish crossover that could indicate a potential reversal.


Support and Resistance Levels:
Support:
The nearest support level is at 1.2340, aligning with the 61.8% Fibonacci retracement level, which has acted as a strong demand zone.
Resistance: The key resistance level is at 1.2490, where the price has faced rejection multiple times. A breakout above this level could open the door for further upside movement.


Conclusion and Consideration:
The GBPUSD H4 analysis suggests bullish momentum, supported by Bollinger Bands, Parabolic SAR, and MACD indicators. However, resistance at 1.2490 remains a key hurdle for further price appreciation. With important UK and US economic data releases today, traders should expect increased volatility. A break above resistance could confirm further bullish momentum, while failure to do so may result in a pullback towards key support levels.


Disclaimer: The analysis provided for GBP/USD is for informational purposes only and does not constitute investment advice. Traders are encouraged to perform their own analysis and research before making any trading decisions on GBPUSD. Market conditions can change quickly, so staying informed with the latest data is essential.


FXGlory
02.13.2025
 
BTCUSD H4 Technical and Fundamental Analysis for 02.17.2025


BTCUSD-H4-technical-and-fundamental-analysis-for-02.17.2025.jpg

Time Zone: GMT +2
Time Frame: 4 Hours (H4)


Fundamental Analysis:

Bitcoin (BTC) is currently experiencing potential volatility due to USD-related events. The U.S. market will have low liquidity today as banks remain closed for Presidents' Day, which typically results in irregular volatility as institutional traders step aside, leaving room for speculative price swings. Additionally, speeches from Federal Reserve officials Patrick Harker and Michelle Bowman could provide insights into future U.S. monetary policy. A hawkish stance may strengthen the USD, adding bearish pressure on BTC USD, while a dovish tone could support risk assets like Bitcoin. Traders should remain cautious as thin liquidity can lead to unexpected price spikes or rapid moves in either direction.


Price Action:
BTCUSD on the H4 timeframe is currently experiencing a bearish move after facing resistance at the 50% Fibonacci retracement level, leading to a sharp decline that has already broken below the 61.8% Fibonacci level. The price has moved from the upper Bollinger Band to the middle band and is now trending downward toward the lower band, signaling increased bearish pressure. If the price fails to hold above key support levels, further downside movement toward the lower Bollinger Band and the next Fibonacci support zones is likely.


Key Technical Indicators:
Bollinger Bands:
The Bollinger Bands indicate that BTCUSD has moved downward from the upper band toward the middle band and is now attempting to break lower. This suggests that selling pressure is increasing, with a potential test of the lower Bollinger Band in the coming sessions. A confirmed break below the lower band could signal further bearish continuation, while a bounce from this area might indicate temporary consolidation before the next move.
MACD (Moving Average Convergence Divergence): The MACD histogram is showing strong bearish momentum, with the MACD line below the signal line, confirming a downside bias. The increasing separation between the MACD and signal lines suggests that selling pressure is still dominant. If the bearish momentum continues to grow, Bitcoin may extend losses toward key support levels. However, a weakening histogram could indicate that the downside move is slowing, signaling possible consolidation or reversal.
RSI (Relative Strength Index): The RSI is currently at 45.76, reflecting bearish sentiment but not yet reaching oversold conditions. This indicates that BTC/USD still has room to move lower before a potential reversal. If the RSI drops below 30, it would signal an oversold scenario, potentially triggering a short-term price correction. Until then, the bearish outlook remains intact, with a downward trend likely to persist in the near term.


Support and Resistance:
Support:
The nearest support level is at $94,877, with a stronger support zone at $94,177, aligning with previous key price action areas.
Resistance: The immediate resistance level is at $97,183, with the next major resistance at $98,866, near the 50% Fibonacci retracement level.


Conclusion and Consideration:
BTCUSD on the H4 chart is currently in a bearish phase, as indicated by the break below the 61.8% Fibonacci level, declining MACD momentum, and RSI trending lower. The price movement from the upper Bollinger Band toward the lower band confirms the increasing selling pressure, with a high probability of further downside unless key support levels hold. With low liquidity due to the U.S. bank holiday, traders should be prepared for irregular volatility and possible sharp movements. Additionally, the upcoming speeches from Federal Reserve officials could provide unexpected market catalysts, influencing Bitcoin’s price action in correlation with USD movements. Caution is advised, and traders should employ proper risk management strategies while monitoring key levels for potential trade setups.


Disclaimer: The analysis provided for BTC/USD is for informational purposes only and does not constitute investment advice. Traders are encouraged to perform their own analysis and research before making any trading decisions on BTCUSD. Market conditions can change quickly, so staying informed with the latest data is essential.


FXGlory
02.17.2025
 
AUDUSD H4 Technical and Fundamental Analysis for 02.19.2025


AUDUSD_H4_Technical_Fundamental_Sentimental_Technical_Analysis.png

Time Zone: GMT +2
Time Frame: 4 Hours (H4)


Fundamental Analysis:

The AUD/USD currency pair is currently influenced by several key fundamental factors. The US Dollar's strength remains in focus as traders await the latest Building Permits and Housing Starts data from the US Census Bureau, which serve as leading indicators for economic activity and construction demand. A stronger-than-expected release could support the USD and apply downward pressure on AUD/USD. Meanwhile, Australia’s economic outlook is shaped by the Melbourne Institute Leading Index and the Wage Price Index, which provide insight into economic growth and inflation trends. If these indicators reflect economic resilience, the AUD could find support. Additionally, market participants will be closely monitoring RBNZ Governor Adrian Orr’s testimony, as any hawkish tone on interest rates could impact risk sentiment and commodity-linked currencies like the AUD.


Price Action:
On the H4 chart, AUD-USD has been in an uptrend following a Morning Star candlestick pattern at the ascending trendline support. The price has reached a key resistance level and is now undergoing a correction. This pullback could extend to Zone 1, where buyers may re-enter the market before the next upward move. The presence of higher highs and higher lows suggests that the overall trend remains bullish unless there is a confirmed break below key support.


Key Technical Indicators:
RSI (Relative Strength Index):
The RSI is currently around 57.17, showing a possible divergence. This suggests a weakening bullish momentum, although it has not yet entered overbought conditions. A drop below 50 could indicate further downside correction.
MACD (Moving Average Convergence Divergence): The MACD histogram is declining, and the signal line is showing signs of a potential bearish crossover. This indicates that while the bullish trend is still intact, buying momentum is decreasing, and further correction could be expected before a continuation of the uptrend.
Stochastic Oscillator: The stochastic is currently at 38.17, pointing downward. This suggests that the price could continue to correct in the short term before finding renewed buying interest at key support levels.


Support and Resistance:
Support:
Immediate support is located at 0.6280, which aligns with the lower boundary of the ascending trendline and a key demand zone. Another support level is found at 0.6350, marking a previous breakout zone and price consolidation area.
Resistance: The nearest resistance level is at 0.6370, where the price is currently consolidating. If bullish momentum persists, the next major resistance level is at 0.6400, which coincides with recent highs and an important psychological barrier.


Conclusion and Consideration:
The AUD/USD pair on the H4 chart continues to maintain its bullish structure but faces a short-term correction phase. Traders should monitor Zone 1 for potential bullish re-entry opportunities. A break below 0.6350 could trigger further downside movement, while a breakout above 0.6370 would confirm the continuation of the uptrend. Given upcoming economic releases, volatility is expected. Traders should watch for USD strength or weakness following the US Building Permits and Housing Starts data, as well as Australian economic reports that may influence the AUD.


Disclaimer: The analysis provided for AUDUSD is for informational purposes only and does not constitute investment advice. Traders are encouraged to perform their own analysis and research before making any trading decisions on AUD/USD. Market conditions can change quickly, so staying informed with the latest data is essential.


FXGlory
02.19.2025
 
GOLDUSD H4 Technical and Fundamental Analysis for 02.20.2025


GOLD-H4-Technical-and-Fundamental-Analysis-for-02.20.2025.jpg

Time Zone: GMT +2
Time Frame: 4 Hours (H4)


Fundamental Analysis:

Gold (XAU/USD) is trading near all-time highs as global market sentiment remains cautious. Today, several high-impact USD news events could influence gold prices. US President Donald Trump’s speech at the FII Priority Summit in Miami may provide insights into economic policies that could impact the dollar’s strength. Additionally, Federal Reserve Governor Philip Jefferson's speech on household balance sheets and initial jobless claims data will shape expectations for future interest rate decisions. If the Federal Reserve adopts a hawkish tone, gold could face downward pressure due to a stronger USD. Conversely, weaker jobless claims or a dovish Fed stance could support gold prices as investors seek safe-haven assets. Traders should also monitor the Philadelphia Fed Business Outlook Survey, which may offer clues about US economic conditions, further impacting gold's direction.


Price Action:
The GOLDUSD H4 chart exhibits a strong bullish trend, with prices moving within the upper half of the Bollinger Bands. Despite minor retracements, the price remains within an upward structure, suggesting ongoing buyer dominance. A key observation is that the recent pullback has been shallow, indicating that bulls still control the market. If the price sustains above the middle Bollinger Band, further upside movement is likely. However, a breakdown below this level may trigger a deeper correction.


Key Technical Indicators:
Bollinger Bands:
The price is currently moving between the middle and upper bands, attempting to reach the upper band again. The overall trend remains bullish, with gold maintaining its strength after breaking multiple all-time highs (ATHs) in recent months.
RSI (Relative Strength Index): The RSI is hovering near 59, suggesting that the market remains in bullish territory but is not yet overbought. This indicates that there is still room for further price appreciation before reaching extreme levels.
MACD (Moving Average Convergence Divergence): The MACD histogram is expanding, with the MACD line positioned above the signal line. This suggests increasing bullish momentum, reinforcing the strength of the uptrend. However, traders should watch for potential divergence, which could indicate a slowdown in momentum.
Stochastic Oscillator: The Stochastic indicator is currently around 42-44, moving out of the oversold region. If the %K line crosses above the %D line, it could confirm a bullish continuation, supporting a move toward higher resistance levels.


Support and Resistance Levels:
Support:
The first key support level is at $2,920, aligning with the middle Bollinger Band and a recent price consolidation area. A break below this level could see further downside toward $2,880.
Resistance: The immediate resistance is at $2,950, which represents the recent high and upper Bollinger Band. A breakout above this level could lead to further gains toward $2,970 and beyond.


Conclusion and Consideration:
Gold remains in a strong uptrend, supported by bullish technical indicators and fundamental factors. With key USD news events today, traders should expect high volatility in the gold market. If the Federal Reserve signals a hawkish stance, gold could face some selling pressure due to a stronger USD. However, if economic concerns arise or jobless claims come in weaker than expected, gold may continue its bullish rally. Traders should closely monitor XAUUSD’s price action around the $2,920 support and $2,950 resistance levels for potential breakouts or pullbacks.


Disclaimer: The analysis provided for XAU/USD is for informational purposes only and does not constitute investment advice. Traders are encouraged to perform their own analysis and research before making any trading decisions on XAUUSD. Market conditions can change quickly, so staying informed with the latest data is essential.


FXGlory
02.20.2025
 
EURNZD H4 Technical and Fundamental Analysis for 02.24.2025


EURNZD-H4-Technical-and-Fundamental-Analysis-for-02.24.2025.jpg

Time Zone: GMT +2
Time Frame: 4 Hours (H4)


Fundamental Analysis:

The EURNZD pair is experiencing market volatility as traders react to key economic data from both the Eurozone and New Zealand. The IFO Business Climate Index from Germany, a leading indicator of economic sentiment, is expected to provide insights into the strength of the European economy. A better-than-expected reading could boost the Euro (EUR), while a weaker-than-expected outcome may pressure the currency. Additionally, the upcoming Core CPI and CPI reports from the Eurozone will significantly impact inflation expectations and influence the European Central Bank's (ECB) monetary policy outlook.
On the New Zealand dollar (NZD) side, recent Retail Sales and Core Retail Sales reports reflect consumer spending trends. Since these are lagging indicators, their impact may be limited unless there is a significant deviation from expectations. The Reserve Bank of New Zealand (RBNZ) continues to monitor inflationary pressures, and upcoming credit card spending data will provide further clues on consumer activity. If the data signals a robust retail environment, the NZD may gain strength.


Price Action:
The EURNZD pair has been in a downward channel since reaching a peak in mid-February. However, the last four candles have been bullish, indicating a potential short-term reversal or correction. The price has swiftly moved from the lower Bollinger Band to the upper band, breaking through the middle band in a single strong bullish move. Additionally, the EUR NZD price is currently testing the 50% Fibonacci retracement level, which serves as a key decision point for traders. If buyers maintain momentum, the next resistance level could be challenged. Conversely, if selling pressure resumes, the downtrend may continue.


Key Technical Indicators:
Bollinger Bands:
The EURNZD price has moved from the lower Bollinger Band to the upper band, signaling increased volatility and a potential breakout from the bearish channel. Despite the overall downtrend, this sudden price spike suggests that bulls are regaining some control. If the price holds above the middle band, further bullish movement could be expected.
Stochastic Oscillator (Stoch 5,3,3): The Stochastic Oscillator is currently near the 75-80 zone, indicating that momentum has shifted towards the bulls. This suggests that the EUR/NZD pair might enter overbought territory soon. However, if the %K and %D lines cross downwards from these levels, a potential pullback may occur.
Awesome Oscillator (AO): The AO histogram has transitioned from deep red to light blue, indicating weakening bearish momentum. While the histogram remains negative, the current trend suggests that bullish pressure is increasing. If the AO crosses above the zero line, it would confirm a stronger upside move.


Support and Resistance Levels:
Support:
The nearest support level is at 1.8180, aligning with the 23.6% Fibonacci retracement level and recent lows. If the EURNZD price breaks below this level, further downside movement could follow.
Resistance: The immediate resistance is at 1.8290, corresponding to the 50% Fibonacci retracement level. A successful breakout above this level could lead to a test of 1.8330 (61.8% Fibonacci level).


Conclusion and Consideration:
The EURNZD H4 chart analysis suggests a potential short-term bullish correction within a broader downtrend channel. The recent bullish momentum, reflected in Bollinger Bands, Stochastic Oscillator, and AO, highlights a possible upside continuation if resistance levels are broken. However, traders should remain cautious as the overall trend remains bearish unless a significant breakout occurs. Key fundamental factors, including IFO Business Climate Index, CPI data from the Eurozone, and New Zealand’s retail sales, could drive volatility in the EUR-NZD pair. Traders should closely monitor these reports, as unexpected economic data could shift market sentiment rapidly.


Disclaimer: The analysis provided for EUR/NZD is for informational purposes only and does not constitute investment advice. Traders are encouraged to perform their own analysis and research before making any trading decisions on EURNZD. Market conditions can change quickly, so staying informed with the latest data is essential.


FXGlory
02.24.2025
 
USDJPY H4 Technical and Fundamental Analysis for 02.25.2025


Time Zone: GMT +2
Time Frame: 4 Hours (H4)


Fundamental Analysis:

The USD/JPY pair is expected to experience volatility today due to multiple speeches from Federal Reserve (FOMC) officials. Chicago Fed President Austan Goolsbee and Dallas Fed President Lorie Logan will speak on economic conditions, potentially providing insights into future monetary policy. If their tone is hawkish, the USD could strengthen, putting upward pressure on the USD-JPY pair. Additionally, key US data, including housing prices and consumer confidence figures, could influence market sentiment. On the Japanese Yen side, the Bank of Japan (BoJ) has released the Corporate Services Price Index (CSPI), an important inflation indicator. Stronger-than-expected data may lead to JPY appreciation, reinforcing the bearish trend in USD vs JPY. However, if the data is weak, expectations of continued BoJ dovish policy could weaken the yen. Traders should remain cautious as market volatility is likely to increase throughout the session.


Price Action:
The USDJPY pair continues to trade within a strong downtrend. The price is currently testing a key support zone at 149.300 - 148.800, which has historically provided significant buying interest. The recent price action suggests an attempt at a bounce, but Resistance Line 1 (150.500 - 150.800) is capping the upside. If the price fails to break above Resistance Line 1, further downside pressure could push the pair below 148.800, confirming a continuation of the bearish trend. However, if buyers gain control and break through Resistance Line 1, the next key level to watch is Resistance Line 2 (152.800), which aligns with the long-term descending trendline. Should the price successfully breach both resistance levels, upside targets include FE 61.8% at 152.900 and FE 100% at 153.800. Until a confirmed breakout occurs, the trend remains bearish.


Key Technical Indicators:
Parabolic SAR:
The last three dots are below the price, signaling a potential shift in momentum toward the upside. However, a break above Resistance Line 1 is necessary to confirm a reversal.
Relative Strength Index (RSI): The RSI is currently at 39.93, indicating that the pair remains in bearish territory. Although it is not yet oversold, a move above 50 would suggest a weakening downtrend and potential bullish momentum.
MACD (Moving Average Convergence Divergence): The MACD histogram remains negative, and the MACD line is below the signal line, confirming that bearish momentum is still in play. A bullish crossover is needed for signs of trend reversal.
Stochastic Oscillator: The Stochastic Oscillator is at 81.27, placing it in the overbought zone. This suggests that the recent price bounce may be short-lived and that further selling pressure could emerge. A bearish crossover would reinforce the downtrend.


Support and Resistance:
Support:
Immediate support is located at 149.300 - 148.800, which represents a significant historical level. If this zone fails to hold, the next key support is 148.315, potentially triggering further downside movement.
Resistance: The nearest resistance level is at 150.500 - 150.800 (Resistance Line 1), a key short-term barrier. A break above this level would indicate bullish momentum. The next major resistance is at 152.800 (Resistance Line 2), which must be breached for a full trend reversal. Additional upside targets include FE 61.8% at 152.900 and FE 100% at 53.800.


Conclusion and Consideration:
The USD/JPY pair remains in a strong downtrend, currently testing a crucial support zone at 149.300 - 148.800. If the price fails to break above Resistance Line 1 (150.500 - 150.800), the bearish trend is likely to continue, potentially pushing the price below 148.800. However, if buyers manage to break above Resistance Line 1, a short-term recovery could be in play, with the next major test at Resistance Line 2 (152.800). With multiple FOMC speeches and key US economic releases scheduled today, traders should prepare for potential market volatility. A hawkish Fed stance could strengthen the USD, while strong JPY fundamentals could keep the pair under selling pressure. Monitoring RSI, MACD, and support/resistance levels will be crucial for confirming the next move.


Disclaimer: The analysis provided for USD/JPY is for informational purposes only and does not constitute investment advice. Traders are encouraged to perform their own analysis and research before making any trading decisions on USDJPY. Market conditions can change quickly, so staying informed with the latest data is essential.


FXGlory
02.25.2025
 
BTCUSD H4 Technical and Fundamental Analysis for 03.03.2025


H4_BTCUSD_Technical_Fundamental_Sentimental_Analysis_for_03_03_2025.jpg

Time Zone: GMT +2
Time Frame: 4 Hours (H4)


Fundamental Analysis:

Bitcoin (BTC) remains sensitive to broad macroeconomic factors and investor sentiment, as the cryptocurrency market shows steady institutional and retail interest. In today’s session, the focus will be on the USD side of the BTCUSD pair, with multiple economic releases such as the ISM Manufacturing PMI, Construction Spending, and the Wards Auto data. Positive US data can strengthen the dollar, potentially pressuring BTC if risk appetite wanes. Meanwhile, Bitcoin’s fundamental drivers include ongoing discussions about its upcoming halving cycle and overall adoption trends, which continue to shape the long-term outlook for the cryptocurrency.


Price Action:

Over the weekend, BTCUSD showed a notable correction, moving from 78k to 92k on the H4 chart but failing to break above the 50% Fibonacci retracement level. This inability to push higher suggests that bullish momentum may be pausing, and the pair could revisit the 38.2% or 23.6% Fib levels if downside pressure intensifies. Price action has temporarily stalled near the upper Bollinger Band, indicating that immediate upside might be capped. Traders are watching closely for any bearish follow-through that could send the price back toward the 0% Fib level in the coming sessions.


Key Technical Indicators:
Bollinger Bands:
The Bollinger Bands on the BTCUSD H4 chart show that the price has recently touched the upper band, signaling a potential overextension. Historically, price retracements often follow upper band touches, especially if accompanied by lower volume or weakening momentum. A break back toward the middle band would indicate a corrective phase, aligning with the possibility of retesting lower Fibonacci levels. Should volatility increase, a close outside the bands could confirm a more decisive breakout or breakdown.
RSI (Relative Strength Index): The RSI appears to be hovering near the upper threshold of neutral territory, reflecting neither extreme overbought nor oversold conditions. This position suggests that while bullish momentum was strong enough to push BTCUSD to 92k, it did not hit a level typically associated with a clear reversal. A downturn in the RSI below the midpoint would reinforce a potential bearish pullback. Conversely, a sustained move above 70 would indicate strong bullish pressure and might invalidate the short-term corrective bias.
MACD (Moving Average Convergence Divergence): The MACD histogram is currently positive, showing that the MACD line remains above the signal line, indicative of ongoing bullish momentum. However, the histogram bars have started to shorten, suggesting a possible slowdown in buying pressure. If the MACD line crosses below the signal line, it would be an early sign of bearish momentum gaining traction. Traders should monitor this indicator closely for confirmation of any trend shift on the H4 timeframe.


Support and Resistance:
Support:
Immediate support is aligned with the 38.2% Fibonacci retracement level, offering the first defense for the bulls. A deeper support can be found near the 0% Fib level, which could become a target if selling pressure intensifies.
Resistance: The nearest resistance lies just above the 50% Fibonacci retracement level around the 92k region. A break above this zone may expose further resistance near the 95k handle, a region of previous price consolidation.


Conclusion and Consideration:

In this technical and fundamental chart daily analysis for BTCUSD H4, the current price action suggests a cautious stance is warranted. While the bullish momentum brought Bitcoin’s price from 78k to 92k, the failure to clear the 50% Fib level points to a potential pullback. Key economic data from the US could drive volatility for BTCUSD, as shifts in risk sentiment often impact the cryptocurrency market. Traders should keep a close eye on the Bollinger Bands, RSI, and MACD for clearer directional cues, alongside upcoming US economic releases that may influence the dollar side of the pair.


Disclaimer: The analysis provided for BTC/USD is for informational purposes only and does not constitute investment advice. Traders are encouraged to perform their own analysis and research before making any trading decisions on BTCUSD. Market conditions can change quickly, so staying informed with the latest data is essential.


FXGlory
03.03.2025
 
AUDUSD Daily Technical and Fundamental Analysis for 03.04.2025


Time Zone: GMT +2
Time Frame: 4 Hours (H4)


Fundamental Analysis:

The AUDUSD pair remains under pressure as the US Dollar (USD) strengthens ahead of key events today. The Federal Reserve’s (FOMC) Williams is scheduled to speak, which could provide insights into future monetary policy directions, potentially impacting USD volatility. Additionally, the RCM/TIPP Economic Optimism Index is expected to show improvement, reinforcing USD strength.
On the Australian Dollar (AUD) side, the market will closely monitor the RBA Deputy Governor Hauser’s speech, as any hawkish remarks could support AUD. Furthermore, key data releases such as the Monetary Policy Meeting Minutes, Retail Sales (forecast 0.3% vs. previous -0.1%), and Current Account (-11.8B vs. -14.1B) could impact AUD’s short-term trajectory. Should retail sales exceed expectations, we may see a temporary boost in AUD, but bearish sentiment prevails given current technical conditions.


Price Action:
The AUDUSD pair has been in a sharp bearish phase, trading within the lower Bollinger Band before entering a correction phase. This corrective movement led the price back toward the midline of the Bollinger Bands, assisting the RSI in recovering from oversold conditions. However, after testing the midline resistance, the pair has resumed its bearish wave, reflecting persistent downward momentum. The MACD indicator also suggests a continuation of the downtrend, as the histogram remains in negative territory with bearish divergence strengthening.


Key Technical Indicators:
Bollinger Bands:
The price initially declined sharply, remaining near the lower band before attempting a recovery. The midline acted as resistance, rejecting further upside and resuming the bearish wave. The continued expansion of the bands indicates high volatility, favoring further downside movement.
MACD (Moving Average Convergence Divergence): The MACD line remains below the signal line, with a bearish histogram indicating ongoing selling pressure. This setup suggests that the bearish trend could persist unless a bullish crossover occurs.
RSI (Relative Strength Index): The RSI rebounded from oversold territory but is now struggling near 36.83, still indicating weak momentum. If the RSI moves below 30, it could signal further selling pressure and potential downside continuation.


Support and Resistance:
Support:
The AUDUSD pair faces key resistance levels at 0.62530, aligning with the midline of the Bollinger Bands, followed by 0.62350, marking a recent swing high, and 0.62300, a psychological level that previously acted as support but has now turned into resistance.
Resistance: On the downside, immediate support is seen at 0.61700, reflecting recent lows, followed by 0.61400, a stronger historical level, and 0.61150, which serves as a major support zone; a break below this level could trigger further downside momentum.


Conclusion and Consideration:
The AUDUSD H4 analysis indicates that the pair remains in a strong bearish trend, with technical indicators such as the MACD, RSI, and Bollinger Bands aligning for further downside movement. The rejection from the Bollinger Band’s midline confirms ongoing selling pressure, while the MACD histogram remains negative, reinforcing bearish momentum. Traders should watch for potential volatility due to upcoming USD and AUD economic releases, especially the FOMC speech and Australian Retail Sales data. If AUD fundamentals disappoint, the pair could retest 0.61700 and potentially lower support levels.


Disclaimer: The analysis provided for AUD/USD is for informational purposes only and does not constitute investment advice. Traders are encouraged to perform their own analysis and research before making any trading decisions on AUDUSD. Market conditions can change quickly, so staying informed with the latest data is essential.


FXGlory
03.04.2025
 
USDCHF H4 Technical and Fundamental Analysis – 03.05.2025


H4_USDCHF_Technical_Fundamental_Sentimental_Analysis_for_05_03_2025.png

Time Zone: GMT +2
Time Frame: 4 Hours (H4)


Fundamental Analysis:

The USDCHF currency pair is currently being influenced by key economic releases from both the US and Switzerland. Today, the Swiss Consumer Price Index (CPI) report will be released, providing insights into inflation trends. A higher-than-expected CPI figure may strengthen the Swiss Franc (CHF) as it could lead to a more hawkish stance from the Swiss National Bank (SNB). Conversely, a weaker CPI reading could put pressure on the CHF, allowing USDCHF to rebound. For the US Dollar (USD), several high-impact events are scheduled, including the ADP Non-Farm Employment Change, ISM Services PMI, and a speech by US President Donald Trump. The ADP employment report serves as an early indicator of the Non-Farm Payrolls (NFP) data, and strong job growth figures could support the USD. Additionally, the ISM Services PMI will gauge the strength of the US service sector, and Trump's speech could bring unexpected volatility depending on any policy announcements. Traders should be cautious of potential price fluctuations due to these scheduled events.


Price Action:
The USD/CHF pair has reached a major support zone at 0.8890, which coincides with the 40% Fibonacci retracement level, a descending trendline support, and a previous horizontal support level. The price briefly dipped below this level but showed signs of buying interest, suggesting a possible reversal. If buyers step in, the pair could target the next Fibonacci level and descending resistance trendline at 0.8960 - 0.9000. However, if the price breaks below 0.8865, it could trigger further downside momentum, potentially leading to new lows.


Key Technical Indicators:
RSI (Relative Strength Index):
The RSI is currently at 29.16, indicating oversold conditions. This suggests that the selling pressure might be weakening, and a potential reversal could be near. However, a confirmation through price action is needed before entering long positions.
MACD (Moving Average Convergence Divergence): The MACD histogram is negative at -0.002211, with the MACD line below the signal line, indicating bearish momentum. However, the decreasing bearish momentum suggests that selling pressure is slowing down. A bullish crossover of the MACD line above the signal line would strengthen the case for a reversal.
Stochastic Oscillator: The Stochastic (5,3,3) is at 27.11, approaching oversold levels. This suggests that the downward momentum is fading, and a bullish crossover in the oscillator would be a strong indication of an upward correction. Traders should watch for a crossover above the 20 level for confirmation.


Support and Resistance:
Support:
Immediate support is located at 0.8890, which aligns with the 40% Fibonacci retracement level, descending trendline support, and previous horizontal support. A break below this level could open the door for further downside toward 0.8865.
Resistance: The nearest resistance level is at 0.8960, which coincides with the 23.6% Fibonacci retracement level and a descending resistance trendline. If bullish momentum continues, the next major resistance lies at 0.9000, which is a key psychological level and a trendline resistance zone.


Conclusion and Consideration:
The USD-CHF pair on the H4 timeframe is currently testing a strong support zone at 0.8890, with multiple technical confluences suggesting a potential bullish reversal. RSI and Stochastic indicate oversold conditions, while MACD shows weakening bearish momentum, which supports the possibility of an upward correction. If the price holds above 0.8890, traders can look for a rebound toward 0.8960 and 0.9000 as potential resistance levels. However, a break below 0.8865 could indicate further downside continuation. With high-impact economic events such as Swiss CPI, US ADP employment data, and ISM Services PMI, traders should expect increased volatility. Trump's speech could also introduce unexpected market movements, making it crucial to manage risk appropriately. Waiting for confirmation through price action signals before entering trades is advisable.


Disclaimer: The analysis provided for USD/CHF is for informational purposes only and does not constitute investment advice. Traders are encouraged to perform their own analysis and research before making any trading decisions on USDCHF. Market conditions can change quickly, so staying informed with the latest data is essential.


FXGlory
03.05.2025
 
EURUSD Daily Technical and Fundamental Analysis for 03.07.2025


Time Zone: GMT +2
Time Frame: 4 Hours (H4)


Fundamental Analysis

EUR/USD is currently influenced by several high-impact events, including Europe’s new purchase orders data and foreign trade figures, as well as a scheduled speech by ECB President Christine Lagarde. Traders are closely monitoring Euro area Employment and GDP releases for additional insight into the region’s economic strength. Meanwhile, the US Dollar faces potential volatility from multiple Federal Reserve (FOMC) member speeches and labor market data (NFP, Unemployment Rate), which could shape market sentiment on monetary policy. Overall, these EUR USD daily chart technical and fundamental analysis factors suggest heightened price action and possible shifts in momentum on the H4 timeframe.


Price Action
The EUR USD H4 chart shows a strong initial upswing since the market opened this week, followed by three consecutive red candles indicating a possible correction. If the bearish movement extends, price action may test the 23.6% Fibonacci Retracement, with potential deeper pullbacks toward the 50% and 61.8% levels. This EURUSD daily technical analysis suggests traders should monitor these key retracement zones for signs of reversal or continuation, as the pair’s momentum could shift rapidly in response to ongoing fundamental developments.


Key Technical Indicators
RSI (Relative Strength Index):
The RSI has moved near overbought territory following the recent sharp rally, signaling that the bullish momentum may be losing steam. With the last three bearish candles, RSI is gradually easing, suggesting a potential cooldown in buying pressure. However, a sustained move below the 50 mark could confirm a deeper correction for EURUSD price action.
MACD (Moving Average Convergence Divergence): The MACD line remains above the signal line, reflecting the recent bullish surge on the EUR-USD H4 chart. Nonetheless, the histogram is starting to narrow, indicating that upward momentum may be slowing. A crossover below the signal line could reinforce a short-term bearish correction scenario.
Stochastic Oscillator: Stochastic readings are hovering in high territory, supporting the notion that EUR USD could be ripe for a pullback. The oscillator’s downward slope from overbought levels suggests a likely pause in the bullish trend. A clear break below the 80 line often points to growing bearish pressure.


Support and Resistance
Support:
The support zone, defined by the 23.6%, 50%, and 61.8% Fibonacci levels at 1.0680, 1.0640, and 1.0600 respectively, forms a layered cushion where buyers may step in during corrections. A bounce off these levels would reinforce bullish sentiment, while a break could signal a shift toward stronger bearish momentum.
Resistance: Resistance is observed at 1.0750, the recent swing high, and at 1.0800, a key psychological barrier, where selling pressure has previously emerged. A successful break above these levels could validate further bullish momentum, whereas failure to breach them may lead to profit taking and a potential retracement.


Conclusion and Consideration
EUR/USD appears poised for a potential corrective move on the H4 chart, with fundamental news and technical signals aligning to indicate caution. Traders should keep an eye on key Fibonacci levels, as well as RSI, MACD, and Stochastic Oscillator readings for confirmation of further downside or a bullish continuation. The upcoming Eurozone data and multiple US FOMC statements could amplify market volatility, so monitoring both technical and fundamental factors is essential.


Disclaimer: The analysis provided for EUR/USD is for informational purposes only and does not constitute investment advice. Traders are encouraged to perform their own analysis and research before making any trading decisions on EURUSD. Market conditions can change quickly, so staying informed with the latest data is essential.


FXGlory
03.07.2025
 

Create an account or login to comment

You must be a member in order to leave a comment

Create account

Create an account on our community. It's easy!

Log in

Already have an account? Log in here.

Members Online

No members online now.

Similar threads

Users Who Are Viewing This Thread (Total: 1, Members: 0, Guests: 1)

Top
AdBlock Detected

We get it, advertisements are annoying!

Sure, ad-blocking software does a great job at blocking ads, but it also blocks useful features of our website. For the best site experience please disable your AdBlocker.

I've Disabled AdBlock    No Thanks