What's new

Forex News Daily Analysis By FXGlory

4.70 star(s) 3 Votes
USDCHF H4 Daily Technical and Fundamental Analysis for 12.30.2024


Time Zone: GMT +2
Time Frame: 4 Hours (H4)


Fundamental Analysis:

The USD/CHF currency pair reflects the exchange rate between the US Dollar (USD) and the Swiss Franc (CHF). Today's focus lies on two significant economic events. For the USD, the Chicago PMI and Pending Home Sales reports are expected to provide insights into the health of the US economy. A higher-than-forecast Chicago PMI would indicate expansion in business activity, supporting the USD. Meanwhile, robust Pending Home Sales data could strengthen the dollar further by reflecting healthy consumer demand. On the CHF side, the KOF Economic Barometer release is expected to give a forward-looking view of the Swiss economy. A stronger reading than forecast may boost the CHF, though the overall impact is likely to be moderate compared to the USD’s key data releases.


Price Action:
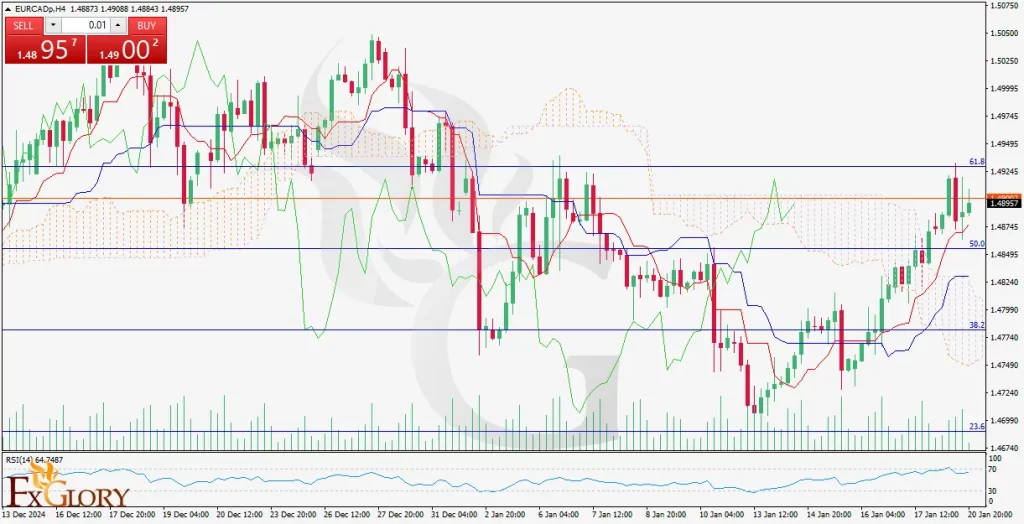
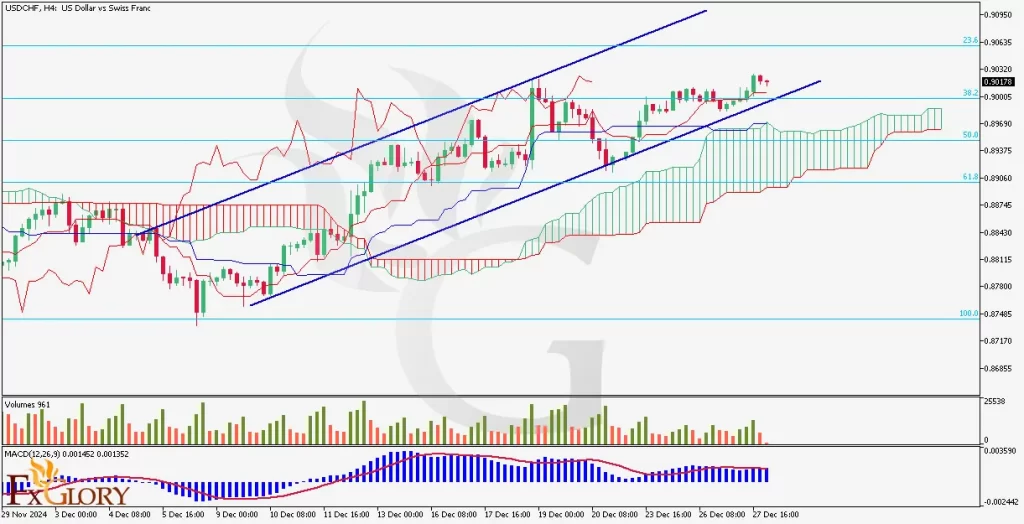
The USDCHF forex pair on the H4 chart remains in a bullish trend, trading within a well-defined ascending channel. Despite the last two bearish candles, the overall momentum stays intact, with the price consolidating near the 23.6% Fibonacci retracement level. The USD-CHF pair is currently positioned above the Ichimoku cloud, signaling a continuation of bullish sentiment. Buyers remain in control, but the price is showing signs of testing minor resistance at the upper boundary of the channel.


Key Technical Indicators:
IchiMoku Cloud:
The USD CHF price is trading above the Ichimoku cloud, confirming a bullish trend. While the last two candles show minor pullbacks, the bullish momentum remains intact, as the price sustains its position above the cloud, indicating a strong support zone.
Volumes: The volume bars indicate a decrease in buying activity, with the last two candles accompanied by red volume bars. This suggests a slowdown in bullish momentum, warranting caution as the price approaches key resistance levels.
MACD (Moving Average Convergence Divergence): The MACD histogram remains positive, with the MACD line staying above the signal line. However, there are signs of waning momentum, as the histogram shows a slight reduction in bullish pressure. This could indicate potential consolidation before the next upward move.


Support and Resistance Levels:
Immediate Support:
0.90000, aligned with the lower boundary of the ascending channel and the 38.2% Fibonacci level.
Key Resistance: 0.90635, corresponding to the 23.6% Fibonacci retracement level and the upper boundary of the channel.


Conclusion and Considerations:
The USDCHF pair remains in a bullish trend on the H4 chart, supported by the Ichimoku cloud and the ascending channel. However, caution is advised as the last two bearish candles and declining volume indicate a potential consolidation phase. Traders should monitor the upcoming Chicago PMI and KOF Economic Barometer releases, as they could trigger increased volatility and influence the USDC/HF pair's direction. A breakout above 0.90635 would confirm further bullish momentum, while a drop below 0.90000 may signal a short-term reversal.


Disclaimer: The analysis provided for USD/CHF is for informational purposes only and does not constitute investment advice. Traders are encouraged to perform their own analysis and research before making any trading decisions on USDCHF. Market conditions can change quickly, so staying informed with the latest data is essential.


FXGlory
12.30.2024
 
XRPUSD H4 Technical and Fundamental Analysis for 12.31.2024


Time Zone: GMT +2
Time Frame: 4 Hours (H4)


Fundamental Analysis

The XRP/USD pair is influenced by both cryptocurrency market dynamics and broader financial indicators. Currently, XRP is experiencing a slightly bearish trend influenced by reduced liquidity due to upcoming financial events. The latest news indicates that German banks will be closed in observance of New Year's Eve, leading to low liquidity and irregular volatility in the forex markets. Additionally, upcoming releases from Standard & Poor's and FHFA on January 28, 2025, regarding housing prices are expected to impact the USD positively if the actual figures exceed forecasts. These fundamental factors suggest potential downward pressure on XRPUSD in the short term, as traders navigate through lower liquidity and anticipate key economic data releases.


Price Action
The XRP/USD pair on the H4 timeframe is currently in a slightly bearish trend. Over the past week, the price has been consolidating in the lower half of the Bollinger Bands, oscillating between the lower and middle bands. Recent candlestick patterns indicate a series of lower highs and lower lows, reinforcing the bearish sentiment. Additionally, the trading volume has been decreasing, suggesting a lack of strong buying interest, which may lead to further downside movement if the bearish trend continues.


Key Technical Indicators
Bollinger Bands:
The XRP/USD pair is trading within the lower half of the Bollinger Bands, positioned between the lower band and the middle band. This placement indicates a slightly bearish trend, as the price struggles to break above the middle band. The narrowing of the Bollinger Bands suggests a potential decrease in volatility, which could precede a significant price movement either upwards or downwards.
Volumes: Trading volumes for XRPUSD have been on a downward trend, signaling reduced market participation. Lower volumes often precede trend reversals or continuation, depending on other indicators. In this case, the declining volumes support the current bearish outlook, as diminished buying interest fails to sustain the price above the middle Bollinger Band.
RSI (Relative Strength Index): The RSI for XRP USD is currently hovering around 40, below the neutral level of 50. This positioning indicates that the pair is in a slightly bearish territory, with potential for further declines. The RSI trend suggests that selling pressure may continue, although it is not yet in oversold territory, leaving room for additional bearish momentum.
Stochastic Oscillator: The Stochastic Oscillator is reflecting bearish momentum, with readings below 50 and moving towards the oversold region. This suggests that the downward movement may persist, as the oscillator indicates sustained selling pressure. However, traders should remain cautious of potential reversals if the oscillator starts to climb from the oversold levels.


Support and Resistance
Support:
The price is currently approaching the 61.8 Fibonacci level, which serves as a strong support zone. This level is expected to provide a significant barrier against further declines, where buying interest may emerge to stabilize the price.
Resistance: On the upside, the 50.0 Fibonacci level acts as an important resistance area. If the price attempts to rise towards this level, selling pressure is likely to increase, preventing further upward movement and potentially causing the price to retreat.


Conclusion and Considerations
The XRP USD pair on the H4 chart is currently exhibiting a slightly bearish trend, supported by the price action within the lower half of the Bollinger Bands and declining trading volumes. Key technical indicators such as RSI and the Stochastic Oscillator reinforce the bearish sentiment, although they do not yet indicate oversold conditions. Traders should monitor the support levels at 0.65 and 0.60 for potential buying opportunities, while resistance at 0.70 and 0.75 may act as barriers to upward movement. Additionally, upcoming economic news, including the closure of German banks and housing price reports from Standard & Poor's and FHFA, could introduce further volatility and influence the USD, thereby impacting the XRP-USD pair. It is advisable to stay cautious and consider these fundamental factors when making trading decisions.


Disclaimer: The analysis provided for XRP/USD is for informational purposes only and does not constitute investment advice. Traders are encouraged to perform their own analysis and research before making any trading decisions on XRPUSD. Market conditions can change quickly, so staying informed with the latest data is essential


FXGlory
12.31.2024
 
EUR/USD H4 Technical and Fundamental Analysis for 01.03.2025


Time Zone: GMT +2
Time Frame: 4 Hours (H4)


Fundamental Analysis:

The EUR/USD news analysis today, shows the pair is poised for significant moves with key data releases. On the Euro side, employment data reveals continued stability, with unemployment claims reflecting economic resilience. In contrast, the USD is influenced by the ISM Manufacturing PMI and Prices Paid reports, which are vital indicators of economic expansion and inflation trends. Positive PMI data could strengthen the USD, exerting downward pressure on EUR/USD. Meanwhile, hawkish statements from Federal Reserve officials could amplify USD's bullish momentum, adding to volatility. Traders are bracing for these fundamental drivers, which could set the tone for the EUR/USD fundamental outlook today.


Price Action:
The EUR/USD technical analysis today on its H4 chart indicates a pronounced bearish move, with the price breaking below key support levels. The large bearish candlestick signals strong seller dominance, and the pair is now testing the 1.0260 support zone. A potential retracement toward the 1.0350 level, now turned resistance, is possible before further downward movement. The overall structure suggests bearish momentum prevailing unless a decisive break above the resistance level occurs.


Key Technical Indicators:
Ichimoku Cloud:
The price has decisively broken below the Ichimoku cloud, signaling a EURUSD bearish trend continuation. Both the Tenkan-sen and Kijun-sen lines are aligned downward, further reinforcing bearish momentum. The Lagging Span also supports this sentiment, sitting well below the price action and cloud.
MACD (Moving Average Convergence Divergence): The MACD histogram shows increasing negative momentum, with the MACD line diverging further below the signal line. This confirms the bearish momentum and suggests that selling pressure remains strong in the short term.


Support and Resistance:
Support Levels:
Immediate support is found at 1.0260, a critical level that, if breached, could lead to further declines toward 1.0200.
Resistance Levels: Key resistance is located at 1.0350, with the next level of significant resistance at 1.0400, near the Ichimoku cloud base.


Conclusion and Consideration:
The EUR/USD forecast today tell us that it is entrenched in a bearish trend, with technical indicators and price action aligning to support further downside. Upcoming US ISM data could provide additional bearish catalysts if stronger-than-expected, bolstering the USD's position. Conversely, any weaker-than-anticipated data could trigger a short-term corrective rally. Traders should closely monitor the 1.0260 support level for a potential breakdown or reversal signals. Effective risk management, including stop-loss orders near resistance levels, is essential given the heightened volatility around today’s fundamental releases.


Disclaimer: The analysis provided for EUR/USD is for informational purposes only and does not constitute investment advice. Traders are encouraged to perform their own analysis and research before making any trading decisions on EURUSD. Market conditions can change quickly, so staying informed with the latest data is essential.


FXGlory
01.03.2025
 
GOLDEUR Daily Technical and Fundamental Analysis for 01.06.2025


GOLDEURO_H4_Daily_Techniacal_and_Fundamental_analysis_and_Price.jpg


Time Zone: GMT +2
Time Frame: 4 Hours (H4)

Fundamental Analysis

The GOLDEUR pair, which reflects the price of gold in euros, is influenced by broader macroeconomic developments, such as inflation expectations and central bank policies. Today’s trading is expected to see lower liquidity due to the Italian banks being closed in observance of Epiphany Day, which could result in irregular volatility for the Euro. Meanwhile, the Eurozone CPI release will be critical for gauging inflation trends, with a higher-than-expected reading likely to strengthen the Euro by raising the probability of further European Central Bank tightening. Gold, however, may act as a safe haven, particularly if upcoming Eurozone economic data highlights uncertainties or weaknesses.


Price Action
In the H4 timeframe, GOLDEUR exhibits a corrective pullback after a strong bullish surge. The pair has recently touched the upper Bollinger Band and is now retracing towards the 23.6% Fibonacci level. Several bearish candles have formed, signaling the potential for further downside correction. If the price sustains below the 23.6% Fib level, it could continue its decline towards the 38.2% and 50.0% Fibonacci retracement levels, aligning with critical support zones. However, should the price regain upward momentum, a re-test of the recent highs near the upper Bollinger Band is possible.


Key Technical Indicators
Bollinger Bands:
The bands have widened significantly, indicating recent high volatility. The price has retreated from the upper band and is approaching the middle band, which acts as a dynamic support level. A break below this level could signal further bearish momentum.
Volume: Volume has decreased slightly during the correction phase, indicating weaker bullish conviction and the possibility of continued downward movement.
RSI (Relative Strength Index): The RSI is currently at 59.48, reflecting moderate bullish momentum. However, it is moving away from the overbought zone, suggesting potential room for further correction.
Stochastic Oscillator: The Stochastic Oscillator is in the oversold region (10.98), hinting at possible bearish exhaustion. This could indicate an imminent reversal or consolidation before further price action develops.


Support and Resistance Levels
Support:
Immediate support is located at 2,571, which aligns with the 23.6% Fibonacci level and recent price retracement.
Resistance: The nearest resistance level is at 2,583, coinciding with the recent high and the upper Bollinger Band.


Conclusion and Consideration
GOLDEUR currently shows signs of a technical correction within its broader bullish trend. While the RSI and Stochastic Oscillator suggest that the correction could soon exhaust, traders should monitor the key Fibonacci levels and Bollinger Band dynamics for clearer signals. The 23.6% Fibonacci level will serve as a critical pivot; a sustained break below it could open the path to deeper retracement levels. Conversely, a rebound could re-establish bullish momentum. The upcoming Eurozone CPI data will likely have a significant impact on GOLDEUR volatility, and lower liquidity due to the Italian holiday might exacerbate price swings.


Disclaimer: The analysis provided for GOLD/EUR is for informational purposes only and does not constitute investment advice. Traders are encouraged to perform their own analysis and research before making any trading decisions on GOLDEUR. Market conditions can change quickly, so staying informed with the latest data is essential.


FXGlory
01.06.2025
 
ETHUSD Daily Technical and Fundamental Analysis for 01.07.2025


Time Zone: GMT +2
Time Frame: 4 Hours (H4)


Fundamental Analysis:

The ETH/USD pair is currently under the influence of a potential "Alcoin season," indicating a surge in interest and investment within the alternative cryptocurrency market. Today's key economic indicators for the USD, including the ISM Services PMI expected to rise to 53.5 from 52.1 and JOLTS Job Openings slightly decreasing to 7.73M from 7.74M, are scheduled for release at 3:00 PM. A stronger-than-expected ISM Services PMI could bolster the USD, potentially exerting downward pressure on ETH/USD. Conversely, stable JOLTS figures are likely to have a neutral impact. Additionally, the increasing interest in alternative coins suggests a bullish sentiment that may support ETH/USD's upward trajectory.


Price Action:
On the H4 timeframe, ETH/USD has embarked on a bullish wave, striving to breach the 0.618 Fibonacci retracement level. The price action reflects a strong upward momentum, with ETH/USD maintaining its stance above key support levels at 3605.70, 3557.5, and 3486.00. This bullish movement suggests sustained buying interest and the potential for further price appreciation. The current attempt to surpass the Fibonacci level is a critical juncture that could either confirm the continuation of the bullish trend or lead to a consolidation phase if the resistance proves too strong.


Key Technical Indicators:
MACD (Moving Average Convergence Divergence):
The MACD is displaying a positive divergence, with the MACD line positioned above the signal line. The increasing histogram indicates growing bullish momentum, supporting the current upward trend in ETH/USD.
Ichimoku Cloud: ETH/USD is trading above the Ichimoku Cloud, which is a strong bullish signal. The cloud's configuration provides robust support for the ongoing upward movement, suggesting that the bullish trend is well-supported by this indicator.


Support and Resistance:
Support Levels:
Immediate Support: 3605.70 – This level aligns with recent price consolidation and serves as the first line of defense against potential downward movements. Secondary Supports: 3557.5 and 3486.00 – These additional support levels provide strong floors that can absorb further declines, reinforcing the bullish outlook.
Resistance Levels: Primary Resistance: 0.618 Fibonacci Retracement Level – This is the key barrier that ETH/USD is attempting to overcome. A successful breach could lead to significant upward movement. Additional Resistance Levels: Previous highs and psychological price points should be monitored for potential resistance zones that may challenge the bullish momentum.


Conclusion and Consideration:
The ETH/USD pair on the H4 chart exhibits robust bullish momentum, underpinned by key technical indicators such as MACD and the Ichimoku Cloud. The current price action, striving to break above the 0.618 Fibonacci retracement level, indicates a strong potential for continued upward movement. Supported by solid support levels at 3605.70, 3557.5, and 3486.00, the bullish trend appears well-supported. However, traders should remain vigilant of the critical resistance at the Fibonacci level and the impact of upcoming USD economic data releases. A successful breakout could present lucrative trading opportunities, while any failure to breach resistance may lead to a retracement towards the established supports.


Disclaimer: The analysis provided for ETH/USD is for informational purposes only and does not constitute investment advice. Traders are encouraged to perform their own analysis and research before making any trading decisions on ETHUSD. Market conditions can change quickly, so staying informed with the latest data is essential.


FXGlory
01.07.2024


EUR/USD H4 Technical and Fundamental Analysis for 01.08.2025


EURUSD_H4_Chart_Daily_Technical_and_Fundamental_Analysis_for_01.jpg

Time Zone: GMT +2
Time Frame: 4 Hours (H4)


Fundamental Analysis:

The EUR/USD news analysis today includes upcoming U.S. labor data such as ADP employment changes and initial jobless claims, which could indicate the health of the U.S. labor market and influence Federal Reserve policy. Strong employment data will likely bolster the dollar, further adding to the EUR/USD bearish outlook. On the Eurozone side, attention turns to German industrial orders and retail sales data. Weak results from these indicators may indicate softening economic activity in the Eurozone, adding to bearish sentiment on the Euro.


Price Action:

the EUR/USD technical analysis today on its H4 candle chart shows mixed sentiment, with the price hovering near a significant support level at 1.0315. The market attempted an upward move but was rejected at the 1.0340 resistance level, forming bearish candlesticks. Sellers appear to have regained control, driving the price back below the key Ichimoku Cloud.


Key Technical Indicators:
Ichimoku Cloud:
The price has broken below the Ichimoku Cloud, signaling bearish momentum. The lagging span further supports a EURUSD bearish bias, and the resistance offered by the Kumo suggests that upward attempts will face strong selling pressure.
MACD (Moving Average Convergence Divergence): The MACD line is below the signal line, and the histogram is negative, confirming bearish momentum. This aligns with the pair’s price action below the Ichimoku Cloud, further supporting a bearish outlook.
RSI (14): The RSI is at 45.63, indicating neutral to slightly bearish momentum. The value is well below the overbought zone, suggesting room for further downward movement.


Support and Resistance:
Support Levels:
1.0315 (key horizontal support), followed by 1.0280 (next potential downside target).
Resistance Levels:
1.0340 (near-term resistance), with further resistance at 1.0375 (a prior high).


Conclusion and Consideration:

The EUR/USD forecast today highlights bearish momentum supported by the pair’s technical indicators and its fundamental headwinds. If the price sustains below the 1.0340 resistance level, it may test the 1.0315 support and potentially move toward 1.0280. Traders should monitor U.S. labor data closely, as stronger-than-expected results could accelerate the pair's bearish trajectory. The Ichimoku Cloud and MACD both indicate bearish trends, suggesting that short positions may be favorable with appropriate risk management. However, a surprise improvement in Eurozone data could provide temporary relief to the pair.


Disclaimer:
The analysis provided for EUR/USD is for informational purposes only and does not constitute investment advice. Traders are encouraged to perform their own analysis and research before making any trading decisions on EURUSD. Market conditions can change quickly, so staying informed with the latest data is essential.


FXGlory
01.08.2025
 
AUDUSD Daily Technical and Fundamental Analysis for 01.09.2025


Time Zone: GMT +2
Time Frame: 4 Hours (H4)


Fundamental Analysis:

The AUD/USD currency pair reflects the exchange rate between the Australian Dollar (AUD) and the US Dollar (USD). Today, the US Dollar might experience heightened volatility due to multiple scheduled Federal Reserve speeches. With FOMC members including Michelle Bowman and Patrick Harker discussing monetary policy and economic outlook, traders will look for any hawkish tones that could signal future interest rate adjustments. Simultaneously, the Australian Dollar's movements will be influenced by recent data on trade balance and retail sales, which serve as key indicators of consumer spending and export performance. Strong retail sales or trade surpluses tend to boost the AUD as they reflect economic resilience.


Price Action:
The AUD/USD pair in the H4 timeframe is showing signs of bearish momentum, with 6 out of the last 10 candles being bearish. However, the last two candles have been bullish, suggesting a potential short-term correction. The price is moving within the 61.8% and 100% Fibonacci retracement levels, signaling a zone of support at 0.6193 and resistance at 0.6255. Additionally, the price remains in the lower half of the Bollinger Bands, attempting to breach the middle band after bouncing from the lower band. The overall bias remains bearish unless the price closes above the middle Bollinger Band.


Key Technical Indicators Analysis:
Bollinger Bands:
The AUD-USD price is trading in the lower half of the Bollinger Bands, signaling bearish momentum. After touching the lower band, the price has started correcting upward, heading toward the middle band. However, it remains below this level, indicating continued downward pressure unless a breakout occurs.
Volumes: Volumes have remained moderate, with no significant spikes indicating strong bullish or bearish conviction. This suggests that the recent price movement may be part of a consolidation phase or a weak corrective rebound rather than a trend reversal.
RSI (Relative Strength Index): The RSI is currently at 45.86, slightly below the neutral 50 mark, which reflects weak bearish momentum. It is far from overbought or oversold levels, leaving room for further price movement in either direction.
Stochastic Oscillator: The Stochastic Oscillator is currently at 40.31 (K line) and 29.88 (D line), indicating a near-oversold condition. This hints at a potential short-term upward correction, though the bearish trend remains dominant overall.


Support and Resistance:
Support:
0.6193 aligns with the 100% Fibonacci retracement level and a recent price rejection area, serving as a key support for the current bearish momentum. 0.6145 is a historical support level below recent lows, which could act as the next downside target if bearish pressure persists.
Resistance: 0.6255 coincides with the 61.8% Fibonacci retracement level and has been a key resistance during the current price correction phase. 0.6310 is the middle Bollinger Band and a potential pivot point for a shift in trend, marking a critical area for bullish attempts.


Conclusion and Consideration:
The AUD/USD pair on the H4 chart shows an ongoing bearish trend, with recent bullish candles signaling a possible short-term correction. Traders should watch for a decisive move above the middle Bollinger Band or a breakdown below 0.6193 for further confirmation of direction. Key technical indicators like RSI and Stochastic suggest potential upward correction, but bearish momentum remains the broader trend. Fundamental drivers, including upcoming FOMC speeches and Australian retail sales figures, could add volatility to the AUD USD pair. A hawkish tone from the Federal Reserve would likely strengthen the USD, while robust Australian trade data could lend support to the AUD.


Disclaimer: The analysis provided for AUD/USD is for informational purposes only and does not constitute investment advice. Traders are encouraged to perform their own analysis and research before making any trading decisions on AUDUSD. Market conditions can change quickly, so staying informed with the latest data is essential.


FXGlory
01.09.2025
 
Last edited:
USD/CAD H4 Technical and Fundamental Analysis for 01.10.2025


Time Zone: GMT +2
Time Frame: 4 Hours (H4)


Fundamental Analysis:

The USD/CAD news analysis today remains at the forefront of traders' focus due to upcoming key economic releases for both the US and Canada. For the USD, Non-Farm Payrolls (NFP), unemployment rate, and labor cost index data are expected to bring heightened volatility. Strong labor market data could reinforce expectations of further tightening by the Federal Reserve, supporting the US Dollar. On the Canadian side, upcoming employment numbers will serve as a barometer of the country's economic resilience. With Canada’s heavy reliance on commodities, stable or improving oil prices might further bolster the Canadian Dollar. However, the market sentiment of this pair, commonly known as the “Loonie,” will depend on the interplay of these fundamental drivers and their divergence.


Price Action:
The USD/CAD H4 chart indicates consolidation within the pair’s moderately bullish trend. USDCAD’s price has rebounded from recent support levels but faces resistance near the upper boundary of the current range. The Loonie’s price action demonstrates narrow candlesticks, signifying indecision among traders. A break above the resistance level at 1.4430 could signal further upward movement, while a failure could see the pair retesting lower support at 1.4350.


Key Technical Indicators:
Bollinger Bands:
The price is hugging the middle band, indicating neutral momentum. A breakout above the upper band would confirm bullish continuation, while a drop below the lower band could suggest bearish sentiment.
Stochastic Oscillator: The stochastic is hovering around the overbought region near 77, suggesting potential exhaustion in the pair’s bullish bias. A downward cross may signal a short-term correction.
Volume: Volume levels remain subdued, suggesting a lack of strong conviction among traders at the current price range. A spike in volume could validate a directional breakout.


Support and Resistance:
Support Levels:
1.4350 (key psychological support) and 1.4280 (lower Bollinger Band).
Resistance Levels: 1.4430 (key short-term resistance) and 1.4500 (higher target in case of a breakout).


Conclusion and Consideration:
The USD/CAD analysis today on its H4 candle chart is in a phase of consolidation with potential for a breakout. Fundamental releases, including the NFP and Canadian employment data, are likely to set the tone for the pair's next major price movement. Technical indicators suggest cautious optimism for bulls but highlight the risk of a pullback from overbought conditions. Traders should monitor key support and resistance levels alongside volume for breakout confirmation. Employing tight stop-losses is recommended due to the volatility expected around the upcoming economic data.


Disclaimer: The analysis provided for USD/CAD is for informational purposes only and does not constitute investment advice. Traders are encouraged to perform their own analysis and research before making any trading decisions on USDCAD. Market conditions can change quickly, so staying informed with the latest data is essential.


FXGlory
01.10.2025
 
GOLD/USD (XAU/USD) Daily Technical and Fundamental Analysis for 01.13.2025


Time Zone: GMT +2
Time Frame: 4 Hours (H4)


Fundamental Analysis:

Gold prices (XAU/USD) reflect mixed sentiment as traders prepare for the release of the US Monthly Treasury Statement. A higher-than-expected surplus could strengthen the US Dollar, pressuring Gold lower, while a deficit may boost Gold as a safe-haven asset. Broader market drivers, including concerns about inflation and central bank monetary policy, continue to influence Gold's bullish momentum. The inverse correlation between the USD and Gold remains critical to monitor as today's news unfolds.


Price Action:
Gold price is moving in a well-defined bullish trend within an ascending channel on the H4 time frame. The price is currently testing the upper region of the Bollinger Bands, indicating strong buyer momentum. While a slight pullback is visible, the price remains comfortably above the 23.6% Fibonacci retracement level, with bulls eyeing a potential breakout near the 0% Fibonacci level for continued upward movement.


Key Technical Indicators:
Bollinger Bands:
Gold’s price remains in the upper half of the Bollinger Bands, touching the upper line, which signals strong bullish momentum. The bands are slightly widening, suggesting increased volatility, while the recent pullback offers potential for buyers to re-enter.
RSI (Relative Strength Index): The RSI is at 66.04, hovering near overbought levels but not yet signaling an overextension. The indicator confirms bullish strength, but traders should be cautious of potential consolidation or minor corrections.
Stochastic Oscillator: The Stochastic Oscillator is near overbought territory at 70.62, which suggests the bullish move could slow down temporarily. Any crossover in this region might indicate short-term pullbacks or consolidation before a continuation.
Volume: Volume levels remain steady, aligning with the ongoing upward trend. Traders should watch for any divergence between price and volume, which could signal weakening momentum.


Support and Resistance Levels:
Support:
The first support level lies at 2666.20, which aligns with the 23.6% Fibonacci retracement and holds as a critical bullish barrier. Below this, 2648.52 provides stronger support within the ascending channel, coinciding with the 38.2% Fibonacci retracement.
Resistance: Resistance is situated at 2687.78, near the current high and the 0% Fibonacci level, acting as a short-term ceiling for buyers. A breakout above this could drive prices toward the channel’s upper boundary near 2709.62, opening the door for further gains.


Conclusion and Consideration:
Gold USD (XAU/USD) on the H4 chart remains in a strong bullish structure, supported by the ascending channel and key Fibonacci levels. While technical indicators suggest overbought conditions, the price action supports the possibility of further upside, especially if buyers manage to push past the immediate resistance. Traders should keep a close eye on today’s US Treasury Statement, as it could introduce significant volatility. Caution is advised if the price breaks below the 23.6% Fibonacci level, which could signal a bearish correction.


Disclaimer: The analysis provided for GOLD/USD is for informational purposes only and does not constitute investment advice. Traders are encouraged to perform their own analysis and research before making any trading decisions on GOLDUSD. Market conditions can change quickly, so staying informed with the latest data is essential.


FXGlory
01.13.2025
 
USDJPY Daily Technical and Fundamental Analysis for 01.14.2025


Time Zone: GMT +2
Time Frame: 4 Hours (H4)


Fundamental Analysis:

The USD/JPY currency pair is being influenced by contrasting economic conditions today. On the Japanese side, economic data highlights a mixed scenario, with reports from the Bank of Japan indicating potential optimism, as the Eco Watchers Index reflects moderate consumer sentiment improvements. However, attention remains focused on whether the BOJ will maintain its ultra-loose monetary policy. For the USD, key economic data, including the Core PPI and comments from a Federal Reserve official, could steer the dollar's strength. With both currencies impacted by varied data, traders should expect choppy price movements as the market digests the economic updates.


Price Action:
In the H4 timeframe, USDJPY is trading within a tight range, showing slight consolidation near the 23.6% Fibonacci retracement level of 157.50. The price recently moved upward, with five consecutive bullish candles indicating modest buying momentum. Despite this, the USD JPY pair lacks strong directional bias, suggesting traders are awaiting further catalysts to confirm the next trend direction. The movement between the Fibonacci level and the middle Bollinger Band signifies a phase of indecision in the market.


Key Technical Indicators:
Bollinger Bands:
The USDJPY price has recently moved from the lower Bollinger Band toward the middle band, supported by five consecutive bullish candles. However, the price has yet to establish a sharp bearish or bullish trend. The narrowing of the Bollinger Bands indicates a period of low volatility, which often precedes significant price movement.
Volume: The volume indicator shows declining activity, reinforcing the market's indecision phase. A breakout from current levels, accompanied by a volume increase, will be critical to confirm directional movement.
MACD (Moving Average Convergence Divergence): The MACD histogram displays decreasing momentum, with the MACD line hovering just below the signal line. This suggests a weakening bullish trend and the potential for a bearish crossover if momentum does not improve.
RVI (Relative Vigor Index): The RVI shows a mildly bearish reading, with the indicator lines sloping downward. This signals caution as the bears might gain strength, especially if the USD-JPY pair fails to sustain support at current levels.


Support and Resistance:
Support:
Immediate support is located at 156.30, which aligns with the 38.2% Fibonacci retracement and serves as a critical level for maintaining bullish sentiment. A break below this level may lead the USD JPY price toward the 155.70 support, corresponding to the 50% Fibonacci retracement and providing a stronger downside buffer.
Resistance: The nearest resistance level is at 157.60, which coincides with the 23.6% Fibonacci retracement and recent highs. A breakout above this level could open the door for further bullish momentum toward 158.20, aligning with the upper Bollinger Band.


Conclusion and Consideration:
The USD/JPY pair on the H4 chart indicates consolidation near the 23.6% Fibonacci retracement level, with bullish momentum slowing as indicated by the MACD and volume metrics. Traders should watch for a breakout above 157.60 or a breakdown below 156.30 to confirm the next directional bias. The upcoming economic releases for both USD and JPY could serve as catalysts for these movements.


Disclaimer: The analysis provided for USD/JPY is for informational purposes only and does not constitute investment advice. Traders are encouraged to perform their own analysis and research before making any trading decisions on USDJPY. Market conditions can change quickly, so staying informed with the latest data is essential.


FXGlory
01.14.2025
 
GBP/USD H4 Technical and Fundamental Analysis for 01.15.2025


GBPUSD_H4_Chart_Daily_Technical_and_Fundamental_Analysis_for_01.jpg

Time Zone: GMT +2
Time Frame: 4 Hours (H4)


Fundamental Analysis:

The GBP/USD price action is heavily influenced by economic indicators and monetary policies in both the UK and the US. As for the GBP/USD news analysis today, we focus on US Consumer Price Index (CPI) data, which serves as a key gauge of inflation. A higher-than-expected CPI could strengthen the USD as traders anticipate further tightening from the Federal Reserve. In the UK, speeches from Bank of England policymakers, alongside inflation and housing market data, are shaping sentiment. These fundamental drivers suggest heightened volatility for the pair’s bias in the near term.


Price Action:

The GBP/USD technical analysis today on its H4 chart shows a potential reversal after forming a recent low around 1.2140. The price is consolidating and testing resistance near 1.2210, which aligns with previous price levels. The candlestick patterns indicate indecision, with neither buyers nor sellers dominating at this stage. A breakout above 1.2230 could confirm bullish momentum, while a move below 1.2140 would signal further downside risk.


Key Technical Indicators:
Parabolic SAR:
The Parabolic SAR dots are above the price candles, indicating GBPUSD’s bearish trend is still in play. However, if the dots flip below the candles, it may suggest a trend reversal.
MACD (Moving Average Convergence Divergence): The MACD histogram is negative, with the MACD line below the signal line. This confirms bearish momentum, although the histogram shows signs of convergence, hinting at a potential reversal.
RSI (Relative Strength Index): The RSI is at 43.91, which is slightly bearish but approaching neutral territory. This indicates a lack of strong momentum, and a move above 50 would suggest a bullish shift.


Support and Resistance:
Support Levels:
The immediate support level is at 1.2140, with a further strong support zone around 1.2100.
Resistance Levels:
The key resistance levels are 1.2210, followed by 1.2230. A break above these levels could open the path toward 1.2300.


Conclusion and Consideration:

The GBP/USD H4 outlook today reflects a market at a crossroads, with technical indicators showing signs of a possible reversal but still leaning bearish. Traders should monitor the US CPI data and Bank of England commentary for fundamental catalysts that could push the pair in either direction. From a technical perspective, a break above 1.2230 would signal bullish continuation, while failure to hold above 1.2140 could lead to further declines. Setting appropriate risk management measures, including stop-loss orders, is crucial given the pair's sensitivity to economic events.


Disclaimer:
The analysis provided for GBP/USD is for informational purposes only and does not constitute investment advice. Traders are encouraged to perform their own analysis and research before making any trading decisions on GBPUSD. Market conditions can change quickly, so staying informed with the latest data is essential.


FXGlory
01.15.2025
 
AUDUSD Daily Technical and Fundamental Analysis for 01.16.2025


AUDUSD-H4-Technical-and-FUndamental-Analysis-For-01.16.2025-.jpg

Time Zone: GMT +2
Time Frame: 4 Hours (H4)


Fundamental Analysis:

The AUDUSD pair reflects the exchange rate between the Australian Dollar (AUD) and the US Dollar (USD). Today, the US Dollar is expected to face mixed influences from a series of key economic data releases, including Retail Sales and Initial Jobless Claims. These indicators will provide insight into consumer spending and labor market conditions, both of which are critical for evaluating the overall health of the US economy. Additionally, the speech by Federal Reserve Bank of New York President John Williams might provide subtle clues regarding future monetary policy, impacting USD volatility. On the other hand, the AUD is being shaped by employment data and consumer inflation expectations. While the Australian labor market remains relatively stable, heightened inflation expectations could influence the Reserve Bank of Australia's monetary outlook. These dynamics make the AUD USD pair a potential hotspot for volatility.


Price Action:
In the H4 timeframe, AUD/USD is currently in a bullish trend. However, after touching the first resistance level at 0.6246, the price has retreated, forming three bearish candles out of the last four. This suggests a weakening bullish momentum as the pair consolidates near the resistance zone. The current price action is testing support near 0.6211, with further downside risk if bearish sentiment persists.


Key Technical Indicators:
Bollinger Bands:
The price has recently moved closer to the middle Bollinger Band, indicating consolidation after a bullish push. The narrowing Bands suggest a decrease in volatility, which may precede a breakout. The price remains above the lower band, keeping the bullish structure intact.
Volumes: Trading volumes show a steady decline, reflecting reduced market participation or hesitation near the resistance level. This aligns with the retreat from 0.6246, signaling a potential pause in bullish activity.
MACD (Moving Average Convergence Divergence): The MACD histogram is in positive territory, with the MACD line above the signal line. However, the diminishing histogram bars suggest weakening bullish momentum. Traders should watch for a potential crossover as an early sign of bearish pressure.
RVI (Relative Vigor Index): The RVI is beginning to slope downward, suggesting a shift in momentum towards bearishness. This indicator confirms the bearish candles seen in recent price action and signals caution for buyers.

Support and Resistance:
Support:
Immediate support is located at 0.6211, which aligns with a recent price consolidation area and the middle Bollinger Band. Secondary support is found at 0.6193, corresponding to the 100% Fibonacci retracement level.
Resistance: The nearest resistance level is at 0.6246, coinciding with the first resistance zone where the price has recently retraced. Further resistance is located at 0.6272, aligning with the 61.8% Fibonacci retracement level and recent highs.


Conclusion and Consideration:
The AUDUSD pair on the H4 chart shows that while the bullish trend remains intact, the retreat from the resistance level at 0.6246 and the appearance of bearish candles suggest a potential shift in sentiment. The weakening MACD momentum and declining RVI emphasize caution, especially if the pair fails to hold above 0.6211. Traders should monitor today's key US economic data and Australian developments, as these could introduce significant volatility.


Disclaimer: The analysis provided for AUD/USD is for informational purposes only and does not constitute investment advice. Traders are encouraged to perform their own analysis and research before making any trading decisions on AUDUSD. Market conditions can change quickly, so staying informed with the latest data is essential.


FXGlory
01.16.2025
 
EURUSD Daily Technical and Fundamental Analysis for 01.17.2025


Time Zone: GMT +2
Time Frame: 4 Hours (H4)


Fundamental Analysis:

The EUR/USD pair is heavily influenced by economic reports and central bank policies from both the European Central Bank (ECB) and the US Federal Reserve. The Eurozone's current economic focus is on inflation metrics and trade balances. With the ECB's monetary policy still leaning towards cautious tightening, any further increase in interest rates could support the euro. Meanwhile, the USD faces upcoming releases related to residential building permits and factory output, which will offer insights into the strength of the US economy. Given the global economic outlook, the USD is expected to hold steady or show signs of further weakness if the data disappoints.


Price Action:
The EURUSD chart for the H4 timeframe shows a clear bearish trend over the past few weeks. The EUR USD price has struggled to maintain above the mid-Bollinger Band, with an overall downward pressure indicated by the tightness of the Bollinger Bands. Despite a brief return to the middle band, the bearish candles indicate that sellers are still in control. A trendline running through the chart highlights a possible continuation of the downward pressure. The market has tested key support areas without much follow-through in price action, indicating a potential break or consolidation soon.


Key Technical Indicators:
Bollinger Bands:
The Bollinger Bands have tightened, indicating that volatility in EUR/USD is decreasing. The price has been fluctuating between the middle and lower bands. After moving from the lower band, the price has struggled to hold above the middle band, indicating that the market may not have sufficient momentum to push higher, and could be preparing for another dip.
Parabolic SAR (Stop and Reverse): The Parabolic SAR is showing spots above the candles, signaling a bearish trend. This is consistent with the ongoing price action, which suggests that the market is likely to continue in its bearish direction unless a reversal occurs with stronger momentum.
RSI (Relative Strength Index): The RSI currently sits at 49.94, suggesting that the EURUSD is in a neutral zone, neither overbought nor oversold. This indicates that there is still room for further downward movement or an eventual reversal, depending on market conditions.
MACD (Moving Average Convergence Divergence): The MACD is showing a very slight negative divergence with the histogram below the zero line, indicating a weakening bearish momentum. However, the EUR-USD price is still below the signal line, suggesting that the bearish trend could persist unless a stronger bullish crossover occurs.
%R (Williams Percent Range): The Williams Percent Range (%R) sits at -68.43, indicating that the price is approaching oversold conditions but has not yet reached the extreme levels. This suggests potential for a reversal if buying pressure intensifies, but for now, the market remains largely bearish.


Support and Resistance:
Support:
The immediate support is at 1.01773, which has acted as a significant level for EURUSD price consolidation in recent weeks. A breakdown below this level could open the door for further downside toward 1.0100.
Resistance: The nearest resistance is around 1.03200, with further resistance seen at 1.03435, which coincides with recent highs and the middle Bollinger Band. A clear break above this level could signal a potential shift to a more neutral or bullish bias.


Conclusion and Consideration:
EUR/USD continues to face a challenging market environment, as the EUR USD pair remains within a clear bearish trend. The technical indicators point towards potential further downside, but the tightening Bollinger Bands, coupled with a neutral RSI, suggest that the market is in a consolidation phase. Traders should watch the key support levels at 1.01773 and 1.0100, as a break below could signal a deeper bearish move. The upcoming data from both the Eurozone and the US will be crucial in determining the next market direction, so caution is advised.


Disclaimer: The analysis provided for EUR/USD is for informational purposes only and does not constitute investment advice. Traders are encouraged to perform their own analysis and research before making any trading decisions on EURUSD. Market conditions can change quickly, so staying informed with the latest data is essential.


FXGlory
01.17.2025
 
USDJPY Daily Technical and Fundamental Analysis for 01.20.2025


Time Zone: GMT +2
Time Frame: 4 Hours (H4)


Fundamental Analysis:

The USDJPY pair is trading in a dynamic environment, influenced by the World Economic Forum (WEF) meetings scheduled today. Comments from central bankers and policymakers during this event could trigger significant market volatility for both the USD and JPY. Meanwhile, a U.S. bank holiday for Martin Luther King Jr. Day is expected to reduce liquidity, potentially leading to erratic price swings. On the JPY side, market sentiment may be shaped by the release of machine orders and industrial production data from Japan. These indicators, key measures of economic activity, could provide insights into the health of the Japanese economy and its impact on the yen.


Price Action:
The USD/JPY pair in the H4 timeframe is showing growth within a bullish trend, with 6 bullish candles in the last 7. Following a recent downtrend channel, the USD JPY price has managed to break the 50% Fibonacci retracement level and is now testing the 156.300 resistance level. Although the current momentum favors bulls, the price faces potential consolidation near this zone as the market awaits further fundamental triggers.


Key Technical Indicators:
Bollinger Bands:
The Bollinger Bands initially expanded during the recent bearish move but are now narrowing as the price stabilizes. The current candle is trading near the middle band, indicating a possible slowdown in momentum as the pair seeks direction.
MACD: The MACD line is gradually approaching the signal line from below, while the histogram reflects diminishing bearish momentum. A bullish crossover is likely if upward pressure continues, signaling stronger buying interest.
Volume: Trading volumes have been tapering off slightly, suggesting reduced market participation due to the U.S. holiday. However, any breakout from key levels could attract renewed interest.


Support and Resistance:
Support:
Immediate support is located at 156.300, which aligns with the middle Bollinger Band and the 50% Fibonacci retracement level, acting as a key area for price consolidation. Secondary support is found at 154.873, corresponding to the 61.8% Fibonacci retracement and a recent price low.
Resistance: The nearest resistance level is at 157.600, coinciding with the upper boundary of the descending channel and a key psychological level. Further resistance is located at 159.460, aligning with the 23.6% Fibonacci retracement level and previous swing highs.


Conclusion and Consideration:
The USDJPY pair on the H4 chart shows signs of recovery within a broader bullish framework. The narrowing Bollinger Bands, combined with a potential MACD crossover, suggest a period of consolidation or a breakout on the horizon. Traders should watch for volatility stemming from the World Economic Forum and Japanese economic releases, which could push the USD-JPY pair decisively through support or resistance levels. Given the low liquidity caused by the U.S. bank holiday, irregular volatility should be anticipated.


Disclaimer: The analysis provided for USD/JPY is for informational purposes only and does not constitute investment advice. Traders are encouraged to perform their own analysis and research before making any trading decisions on USDJPY. Market conditions can change quickly, so staying informed with the latest data is essential.


FXGlory
01.20.2025
 
EURCAD Daily Technical and Fundamental Analysis for 01.21.2025


Time Zone: GMT +2
Time Frame: 4 Hours (H4)


Fundamental Analysis:

Today, the EURCAD pair is influenced by economic releases from both the Eurozone and Canada. The Eurozone will see the release of the German ZEW Economic Sentiment and the broader ZEW Economic Sentiment for the Eurozone, which are indicators of investor sentiment and economic expectations. A higher reading might support the Euro, signaling economic optimism in the region. For Canada, there is a significant release of inflation data, including CPI m/m, Median CPI y/y, and Core CPI m/m. With the potential for inflation to come in lower than expected (-0.7% m/m versus 0.0% forecast), this could indicate a cooling economy, possibly weakening the CAD. Traders will be looking for these economic prints to provide direction for the EURCAD pair.


Price Action:
The EURCAD pair on the H4 timeframe is currently experiencing a bullish trend. The price recently broke above the Ichimoku Cloud, a key technical indicator, signaling a shift to a bullish market sentiment. As the price continues to trend higher, it has cleared key resistance levels, indicating that the buyers are in control. A possible continuation of this upward movement is expected, given that the RSI remains below 70, indicating that the market has not yet reached overbought conditions. The recent price action shows an upward momentum, with minor retracements being bought into, suggesting a strong bullish bias.


Key Technical Indicators:
Ichimoku Cloud:
The price has recently broken above the Ichimoku Cloud, signaling a bullish market condition. The Chikou Span is above the price, and the Tenkan-Sen and Kijun-Sen lines are both pointing upwards, reinforcing the positive outlook.
RSI (Relative Strength Index): The RSI is currently at 64.74, comfortably below the 70 overbought threshold. This suggests there is still room for further bullish movement without entering overbought territory. As the market remains in healthy bullish conditions, the RSI confirms that the momentum is still positive and that a continuation of the trend is likely.


Support and Resistance Levels:
Support:
The lower points of the recent candles around 1.48677 and 1.48555 serve as the immediate support level.
Resistance: The most recent resistance levels around the current price locate around 1.49360 and 1.50000 (psychological level).


Conclusion and Consideration:
The technical analysis of EURCAD suggests a bullish outlook, supported by the recent break above the Ichimoku Cloud, the healthy RSI reading, and the overall upward price action. The pair is likely to continue its bullish trend as long as the price remains above the identified support levels, with potential target resistance at 1.49360 and 1.49740. However, given the upcoming economic releases today, including inflation data from Canada and sentiment indices from the Eurozone, there could be increased volatility. Traders should keep an eye on these data points, as any surprises could influence the direction of the pair in the short term.


Disclaimer: The analysis provided for EUR/CAD is for informational purposes only and does not constitute investment advice. Traders are encouraged to perform their own analysis and research before making any trading decisions on EURCAD. Market conditions can change quickly, so staying informed with the latest data is essential.


FXGlory
01.21.2025
 
USDCAD H4 Technical and Fundamental Analysis for 01.23.2025


USDCAD-H4-Technical-And-Fundamental-Analysis-for-01.23.2025-.png

Time Zone: GMT +2
Time Frame: 4 Hours (H4)


Fundamental Analysis:

Today, USDCAD traders will be paying close attention to key economic indicators and events affecting both the USD and CAD. On the CAD side, Statistics Canada will release Core Retail Sales data, a primary gauge of consumer spending. Positive retail figures could bolster CAD strength, as they reflect healthy economic activity. Additionally, the World Economic Forum in Davos might feature remarks from Canadian policymakers, potentially influencing the market.
For the USD, initial jobless claims from the Department of Labor are scheduled, serving as an essential indicator of labor market health. Lower-than-expected claims could reinforce USD strength. Additionally, developments in energy inventories and global crude oil prices will significantly impact CAD due to Canada's reliance on the energy sector. Lastly, the World Economic Forum could spark USD volatility through central bank commentary.


Price Action:
The USDCAD pair has been in a bullish trend on the H4 timeframe but exhibits fluctuating behavior between bullish and bearish movements. The USD/CAD price has been oscillating between the 38.2% and 23.6% Fibonacci retracement levels. Currently, the price is inching toward the 23.6% level, indicating potential further bullish movement. The USD CAD price has also rebounded from the lower Bollinger Band and is now aligning closer to the middle band, signifying improving bullish momentum.


Key Technical Indicators:
Bollinger Bands:
The Bollinger Bands are widening, indicating increasing volatility. After testing the lower band, the price has moved toward the middle band, reflecting growing bullish sentiment. A sustained move above the middle band could confirm a continuation of the bullish trend.
Relative Strength Index (RSI): The RSI is currently at 50.36, sitting in neutral territory. This indicates neither overbought nor oversold conditions, leaving room for the USDCAD price to move higher. An upward push beyond 60 would signal strengthening bullish momentum.
MACD (Moving Average Convergence Divergence): The MACD histogram remains slightly negative but shows signs of recovery. The MACD line is approaching the signal line, suggesting that bullish momentum is building. A crossover into positive territory would confirm a bullish reversal.


Support and Resistance:
Support:
Immediate support is located at 1.4320, aligning with the 50% Fibonacci retracement level and the lower Bollinger Band. A further drop would find stronger support at 1.4250, which coincides with recent lows and a critical psychological level.
Resistance: The nearest resistance is at 1.4385, situated at the 23.6% Fibonacci retracement level and close to the middle Bollinger Band. A breakout above this level would target the next significant resistance at 1.4450, aligning with the upper Bollinger Band and recent swing highs.


Conclusion and Consideration:
The USD-CAD H4 chart analysis suggests the bullish trend remains intact, supported by key indicators such as Bollinger Bands, RSI, and MACD. However, fluctuations between the 38.2% and 23.6% Fibonacci levels reflect short-term uncertainty. Traders should watch for a break above 1.4385 for bullish confirmation, while a dip below 1.4320 could signal bearish risks. Given today’s upcoming CAD Retail Sales data and USD labor market figures, volatility is likely. Traders should remain cautious of potential sharp moves. Energy inventory releases could also influence CAD due to oil market sensitivity.


Disclaimer: The analysis provided for USD/CAD is for informational purposes only and does not constitute investment advice. Traders are encouraged to perform their own analysis and research before making any trading decisions on USDCAD. Market conditions can change quickly, so staying informed with the latest data is essential.


FXGlory
01.23.2025
 
GBPUSD H4 Technical and Fundamental Analysis for 01.24.2025


Time Zone: GMT +2
Time Frame: 4 Hours (H4)


Fundamental Analysis:

The GBP/USD currency pair represents the exchange rate between the British Pound (GBP) and the US Dollar (USD), a popular forex pair due to its volatility and liquidity. Today’s economic calendar highlights several key events that could influence GBP USD forex pair. On the USD side, PMI figures for both manufacturing and services, along with home sales data, provide critical insights into the economic outlook. Robust PMI readings could strengthen the dollar by signaling economic expansion. Meanwhile, the UK releases include consumer confidence and PMI data, which are crucial for understanding market sentiment toward the Pound. Positive GfK consumer confidence and manufacturing PMI data could provide a boost to GBP, while weaker-than-expected figures could weigh on its performance.


Price Action:
The GBPUSD pair has been trading within a slight bullish channel, gradually climbing from its lower boundary toward the upper boundary. Currently, the GBP-USD price has bounced from the middle Bollinger Band and reached the upper band, though the last two candlesticks are red, indicating a potential pullback or consolidation. The overall price movement reflects steady upward momentum, but bearish candlesticks suggest sellers are testing the upper boundary's strength.


Key Technical Indicators:
Bollinger Bands:
The Bollinger Bands indicate a mild bullish trend, with the GBP/USD price moving from the middle band toward the upper band. The last two bearish candles after touching the upper band suggest a possible retracement toward the middle band or consolidation around current levels.
Parabolic SAR: The Parabolic SAR shows an upward bias, with its last three dots positioned below the candles, supporting the ongoing bullish trend. However, traders should monitor closely for any reversal in the SAR placement, as it could signal a weakening trend.
RSI (Relative Strength Index): The RSI is currently at 58.63, suggesting a neutral-to-bullish momentum. It indicates that the market still has room to rise without being overbought, though the slight decline reflects the GBP USD pair’s recent bearish candlesticks.


Support and Resistance:
Support:
Immediate support is located at 1.2280, which aligns with the middle Bollinger Band and a recent consolidation area. Further support lies at 1.2200, the lower boundary of the ascending channel and a psychological level.
Resistance: The nearest resistance level is at 1.2350, coinciding with the upper boundary of the ascending channel. A stronger resistance is at 1.2400, aligning with recent highs and acting as a psychological barrier.


Conclusion and Consideration:
The GBPUSD pair on the H4 chart is showing a gradual bullish trend within an ascending channel, supported by technical indicators such as Bollinger Bands and Parabolic SAR. However, the red candles near the upper Bollinger Band suggest a possible pullback or consolidation. RSI readings indicate room for further upward movement, though traders should remain cautious of potential reversals.
Today’s news releases, particularly the US and UK PMI figures, along with consumer confidence data, could introduce significant volatility. A strong PMI from the US could pressure GBP-USD lower, while upbeat UK data may provide further support for the Pound. Traders are advised to closely monitor the upcoming news and consider key support and resistance levels when making trading decisions.


Disclaimer: The analysis provided for GBP/USD is for informational purposes only and does not constitute investment advice. Traders are encouraged to perform their own analysis and research before making any trading decisions on GBPUSD. Market conditions can change quickly, so staying informed with the latest data is essential.


FXGlory
01.24.2025
 
AUDUSD Daily Technical and Fundamental Analysis for 01.28.2025


Time Zone: GMT +2
Time Frame: 4 Hours (H4)


Fundamental Analysis:

The AUDUSD currency pair reflects the exchange rate between the Australian Dollar (AUD) and the US Dollar (USD). Today, the Australian Consumer Price Index (CPI) data was released, showing quarterly growth of 0.3%, slightly above the forecast of 0.2%. On an annual basis, CPI stands at 2.5%, aligning with expectations and indicating a steady inflationary environment. The Trimmed Mean CPI, which excludes volatile items, reported 0.6%, slightly below the forecast of 0.8%, suggesting subdued core inflation.
For the USD, critical data releases include Core Durable Goods Orders and Durable Goods Orders later in the day, with expectations of 0.4% and 0.3% growth respectively. Additionally, the CB Consumer Confidence Index, projected at 105.7, will provide insights into consumer sentiment, potentially impacting the USD’s performance. This combination of economic data points may lead to increased volatility for the AUDUSD pair.


Price Action:
The AUDUSD H4 chart indicates that the pair is currently in a correction phase following a strong bearish wave. The correction trend line has been broken, signaling the potential continuation of the broader bearish trend. Price action shows a rejection from resistance near 0.63000, with the pair now consolidating below this level. Recent candles indicate weakening bullish momentum, and sellers appear to be regaining control.


Key Technical Indicators:
RSI (Relative Strength Index):
The RSI is displaying a weak bearish divergence, currently at 48, indicating that bearish momentum is building but is not yet overextended. This supports the view of a potential continuation of the bearish wave.
MACD (Moving Average Convergence Divergence): The MACD histogram confirms bearish momentum, with a crossover below the signal line and increasing negative histogram bars. This aligns with the trendline break and suggests further downside potential.


Support and Resistance:
Support:
Immediate support levels are identified at 0.62665, 0.62380, and 0.62300. These levels will be critical for assessing the strength of bearish pressure.
Resistance: Resistance levels are located at 0.63000, 0.63235, and 0.63520. Any sustained break above these levels would invalidate the bearish scenario.


Conclusion and Consideration:
The AUDUSD pair on the H4 chart is in a correction phase, but the bearish trend appears likely to resume, supported by the broken corrective trendline and confirmation from the RSI and MACD. Traders should monitor key support levels for potential bearish continuation and watch for a rejection at resistance levels to validate the downtrend. Upcoming US economic data, particularly Durable Goods Orders and CB Consumer Confidence, could introduce additional volatility. Caution is advised given the mixed inflation data from Australia and the potential for USD strength later in the session.


Disclaimer: The analysis provided for AUD/USD is for informational purposes only and does not constitute investment advice. Traders are encouraged to perform their own analysis and research before making any trading decisions on AUDUSD. Market conditions can change quickly, so staying informed with the latest data is essential.


FXGlory
01.28.2025
 
SILVERUSD Daily Technical and Fundamental Analysis for 01.30.2025


Time Zone: GMT +2
Time Frame: 4 Hours (H4)


Fundamental Analysis

Silver (XAG/USD) remains a key asset in the commodities market, influenced by economic data, geopolitical risks, and inflationary trends. Today, the US economic calendar includes GDP growth figures, jobless claims, and inflation reports, which will play a significant role in shaping USD strength and, consequently, silver prices. Strong GDP data could boost the dollar, leading to downward pressure on silver, while weak figures may drive silver prices higher as investors seek safe-haven assets. Additionally, the pending home sales report and natural gas inventory data may impact overall market sentiment, influencing silver demand. Given the Federal Reserve’s upcoming policy decisions, traders are closely watching for clues on future interest rate adjustments, which could affect the opportunity cost of holding non-yielding assets like silver.


Price Action
Silver’s H4 chart analysis suggests that the price action has been bullish in recent sessions. The price recently broke above the Ichimoku cloud, indicating a shift in momentum. However, it has reached the 0% Fibonacci retracement level, which has acted as a strong resistance zone multiple times this month. If silver fails to break and sustain above this level, a retracement towards 30.50 or 30.17 is possible. Conversely, a confirmed breakout above resistance could lead to a continuation towards 31.00 and beyond. The current candles indicate strong bullish pressure, but overbought conditions in momentum indicators suggest a possible correction before further upside.


Key Technical Indicators
Ichimoku Cloud:
The price has broken above the Ichimoku cloud, signaling a potential bullish continuation. The green cloud below the price suggests a supportive trend, while the 0% Fibonacci level remains a key resistance. If silver fails to break higher, a pullback towards the cloud’s upper boundary could occur before another attempt to rally.
Adaptive Moving Average (Period 9, Fast EMA 2, Slow EMA 30): Silver’s candles have crossed above the moving average line, indicating strong bullish momentum. The price action remains above the EMA 30, suggesting that the short-term trend remains positive. As long as silver stays above this moving average, the bullish outlook remains intact.
RSI (Relative Strength Index 14): The RSI is currently at 62.33, indicating bullish momentum but not yet in overbought territory. This suggests that there is still room for further upside before reaching exhaustion. However, traders should watch for potential divergence or a move above 70, which could indicate overbought conditions and a potential reversal.
Williams %R (14): The Williams %R indicator is at -12.31, signaling that silver is nearing overbought conditions. This suggests that while bullish momentum is strong, a short-term pullback or consolidation may occur before another upward push.


Support and Resistance Levels
Resistance:
The first key resistance is at 30.88, aligning with the 0% Fibonacci retracement, a strong barrier this month. A breakout could lead to 31.00, a psychological resistance, with further upside toward 31.20 - 31.50.
Support: Immediate support lies at 30.50 (23.6% Fibonacci retracement), followed by 30.17 (38.2% Fibonacci retracement). If bearish pressure increases, 29.84 (50% Fibonacci retracement) will be a crucial level to watch.


Conclusion and Consideration
Silver (SILVERUSD) on the H4 chart shows a bullish trend, supported by a break above the Ichimoku cloud, a moving average crossover, and strong RSI momentum. However, the Fibonacci 0% resistance at 30.88 has held firm, making it a key level to watch. If silver breaks above this resistance, a rally towards 31.00 or higher is likely. Conversely, failure to break could lead to profit-taking and a retracement towards 30.50 or lower.
Upcoming US economic data releases, particularly GDP growth and jobless claims, could introduce volatility. A stronger USD may weigh on silver prices, while weaker data could support further gains. Traders should monitor key support and resistance levels closely and adjust their strategies accordingly.


Disclaimer: The analysis provided for SILVER/USD is for informational purposes only and does not constitute investment advice. Traders are encouraged to perform their own analysis and research before making any trading decisions on SILVERUSD. Market conditions can change quickly, so staying informed with the latest data is essential.


FXGlory
01.30.2025
 
GOLD (XAU/USD) H4 Technical and Fundamental Analysis for 01.31.2025


Time Zone: GMT +2
Time Frame: 4 Hours (H4)


Fundamental Analysis

Gold (XAU/USD) continues its bullish trend as investors anticipate key US economic data releases today. The Personal Consumption Expenditures (PCE) index, a crucial inflation gauge for the Federal Reserve, is set to be released, along with Personal Income and Spending reports. A higher-than-expected reading could strengthen the US dollar, potentially putting pressure on gold. However, growing expectations of a dovish Fed stance and persistent global economic uncertainties continue to support gold as a safe-haven asset. Additionally, Federal Reserve Governor Michelle Bowman’s speech could provide further clues on future monetary policy, influencing Gold/USD’s next move.


Price Action
The H4 timeframe for gold (XAU/USD) reveals a clear bullish price structure, trading within an ascending channel. The price action consistently forms higher highs and higher lows, signaling a continuation of the uptrend. Recent movement shows gold attempting to break above a key psychological level, while a rejection at the upper trendline may trigger a short-term pullback. Consolidation above this level could provide the momentum needed for further upside movement.


Key Technical Indicators
Ichimoku Cloud:
The price remains well above the Ichimoku cloud, reinforcing the prevailing bullish sentiment. The Tenkan-Sen (red line) and Kijun-Sen (blue line) are trending upwards, confirming continued momentum. The cloud’s support zone aligns with recent consolidation levels, suggesting strong demand at lower levels.

Volumes: Buying interest remains strong, with volume spikes accompanying bullish moves. This confirms active participation in the uptrend. A sudden decrease in volume on further rallies may indicate exhaustion, warranting caution for potential pullbacks.
Bulls Indicator: The Bulls(13) oscillator remains positive, reflecting persistent buying pressure. The elevated levels indicate that buyers still dominate, but a declining reading while price stays high could hint at a weakening bullish trend.
RSI (Relative Strength Index - 14): The RSI is currently at 71.16, placing gold near overbought territory. While this supports strong bullish momentum, it also increases the likelihood of a short-term retracement or consolidation before another rally. A move above extreme levels may signal trend exhaustion.


Support and Resistance
Support:
The ascending channel’s lower boundary at $2,750-$2,760 serves as a strong support zone, aligning with recent retracement levels.
Resistance: The $2,800 psychological level remains a key resistance; a breakout above could drive further bullish momentum toward $2,825-$2,850.


Conclusion and Consideration
Gold (XAU/USD) maintains a strong bullish trend, supported by the Ichimoku Cloud, rising RSI, and increasing volume. The ascending channel continues to define price movement, with bulls in control. However, overbought conditions suggest a potential pullback before the next leg higher. Today’s US PCE inflation data and Federal Reserve commentary may introduce market volatility, influencing gold’s short-term trajectory. Traders should monitor the gold price reactions at key levels and manage risk accordingly.


Disclaimer: The analysis provided for XAU/USD is for informational purposes only and does not constitute investment advice. Traders are encouraged to perform their own analysis and research before making any trading decisions on XAUUSD. Market conditions can change quickly, so staying informed with the latest data is essential.


FXGlory
01.31.2025
 

Create an account or login to comment

You must be a member in order to leave a comment

Create account

Create an account on our community. It's easy!

Log in

Already have an account? Log in here.

Members Online

No members online now.

Similar threads

Users Who Are Viewing This Thread (Total: 1, Members: 0, Guests: 1)

Top
AdBlock Detected

We get it, advertisements are annoying!

Sure, ad-blocking software does a great job at blocking ads, but it also blocks useful features of our website. For the best site experience please disable your AdBlocker.

I've Disabled AdBlock    No Thanks