Capitalcore
Member
GBP/USD Analysis: Cable Declines in Bearish Channel
The GBP/USD forex pair, often nicknamed "Cable" due to its historical connection via the transatlantic telegraph cable, is one of the most actively traded pairs in the forex market. It represents the exchange rate between the British pound sterling (GBP) and the US dollar (USD), two of the world's most influential currencies. Traders closely monitor this pair’s forecast for insights into the economic conditions and monetary policies of the UK and the US.
Today’s GBP/USD news analysis features several critical USD-focused reports, notably the ISM Manufacturing PMI and the ISM Manufacturing Prices Index. Both serve as leading indicators of economic health, inflation trends, and consumer confidence. Positive data exceeding forecasts could strengthen the USD by signaling economic expansion, potentially impacting the GBP/USD prices negatively. Simultaneously, GBP traders are attentive to monetary aggregates and mortgage approval data, revealing consumer confidence and lending conditions. Given these developments, the pair's movement will likely hinge on divergent economic trends and central bank policy trajectories. The Fed's hawkish signals via speakers like Richmond Fed President Thomas Barkin could further influence market sentiment.
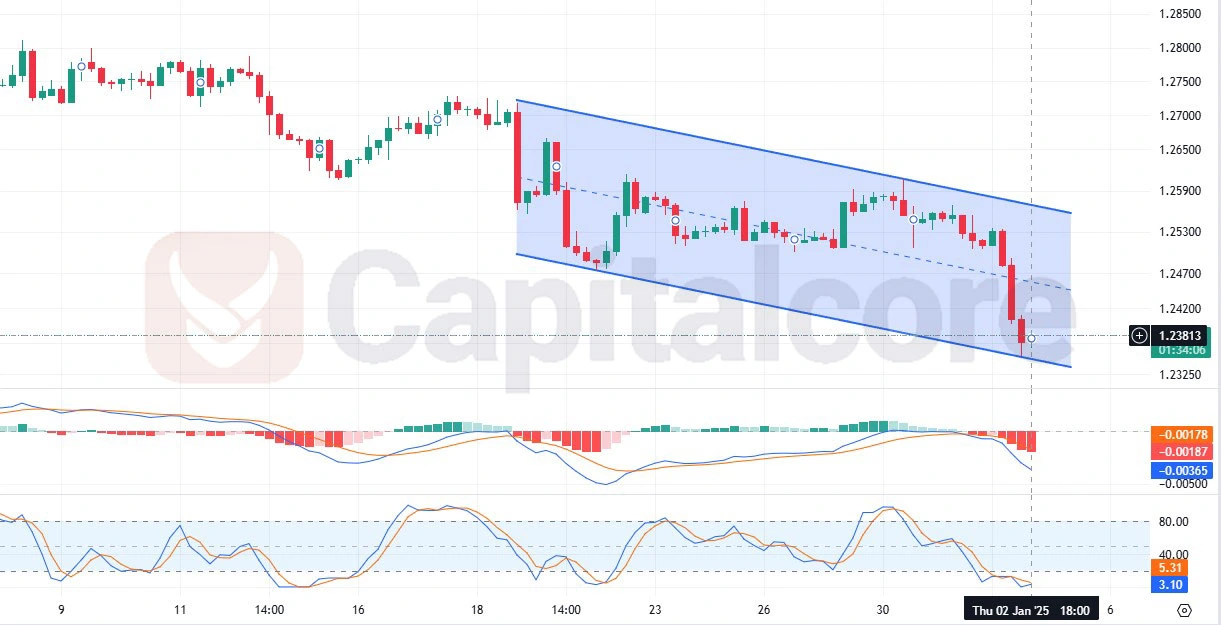
Chart Notes:
• Chart time-zone is UTC (+02:00)
• Candles’ time-frame is 4h.
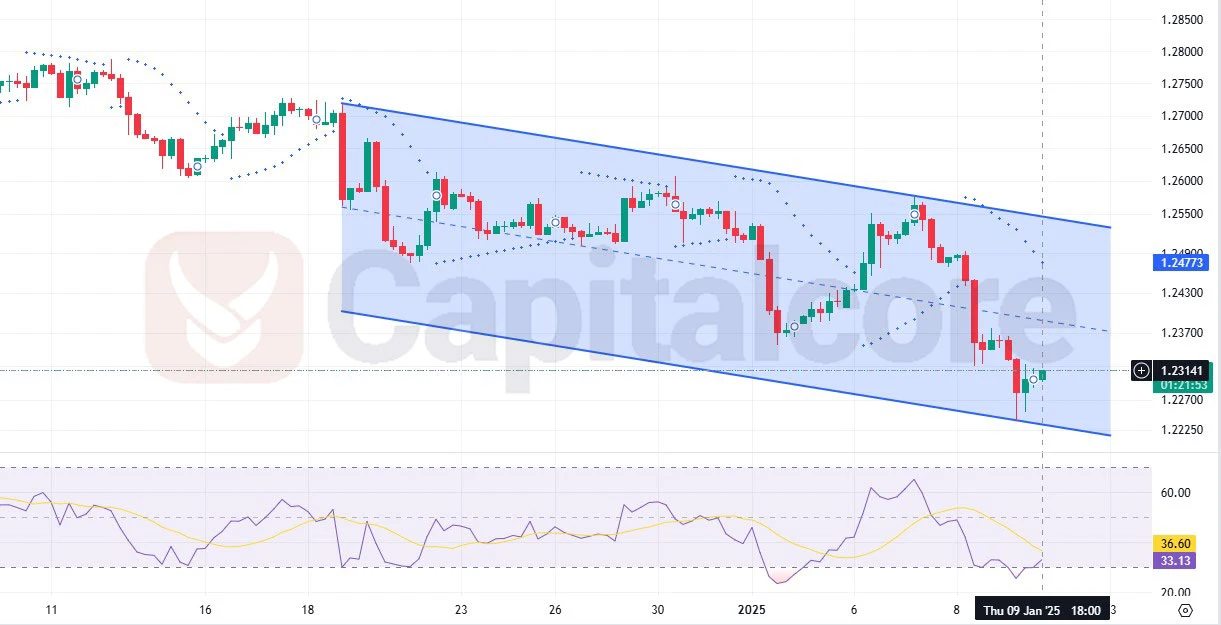
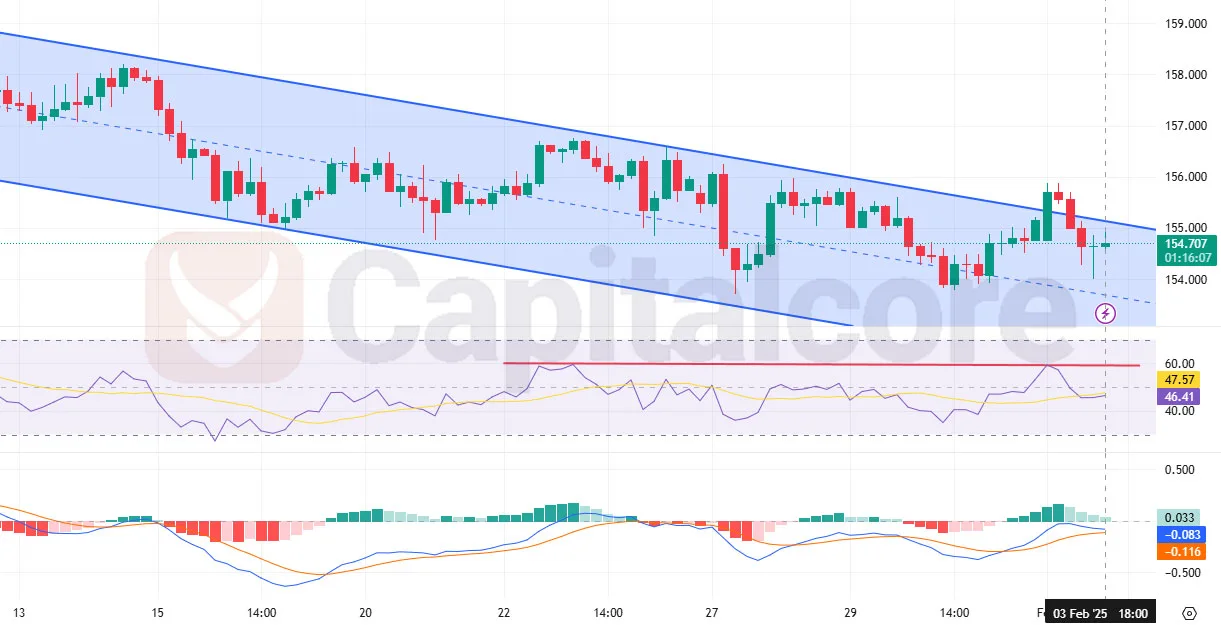
The GBP/USD H4 chart reveals a strong downtrend within a well-defined descending channel. The Cable’s price action is consistently testing and respecting the channel boundaries, suggesting further bearish momentum. The Stochastic RSI shows oversold conditions with its oscillator near the lower band, hinting at potential short-term consolidation or a corrective pullback. The MACD histogram indicates a strong GBP/USD bearish bias, with the signal line diverging below the zero level. These indicators collectively support the likelihood of continued bearish pressure unless major support levels, such as 1.2380, hold firm.
For traders, a break below the lower channel boundary might signal further downside to key levels around 1.2300, while a bullish reversal would require a breach of the upper channel and sustained movement above 1.2550.
• DISCLAIMER: Please note that the above analysis is not an investment suggestion by “Capitalcore LLC”. This post has been published only for educational purposes.
Capitalcore
The GBP/USD forex pair, often nicknamed "Cable" due to its historical connection via the transatlantic telegraph cable, is one of the most actively traded pairs in the forex market. It represents the exchange rate between the British pound sterling (GBP) and the US dollar (USD), two of the world's most influential currencies. Traders closely monitor this pair’s forecast for insights into the economic conditions and monetary policies of the UK and the US.
Today’s GBP/USD news analysis features several critical USD-focused reports, notably the ISM Manufacturing PMI and the ISM Manufacturing Prices Index. Both serve as leading indicators of economic health, inflation trends, and consumer confidence. Positive data exceeding forecasts could strengthen the USD by signaling economic expansion, potentially impacting the GBP/USD prices negatively. Simultaneously, GBP traders are attentive to monetary aggregates and mortgage approval data, revealing consumer confidence and lending conditions. Given these developments, the pair's movement will likely hinge on divergent economic trends and central bank policy trajectories. The Fed's hawkish signals via speakers like Richmond Fed President Thomas Barkin could further influence market sentiment.

Chart Notes:
• Chart time-zone is UTC (+02:00)
• Candles’ time-frame is 4h.
The GBP/USD H4 chart reveals a strong downtrend within a well-defined descending channel. The Cable’s price action is consistently testing and respecting the channel boundaries, suggesting further bearish momentum. The Stochastic RSI shows oversold conditions with its oscillator near the lower band, hinting at potential short-term consolidation or a corrective pullback. The MACD histogram indicates a strong GBP/USD bearish bias, with the signal line diverging below the zero level. These indicators collectively support the likelihood of continued bearish pressure unless major support levels, such as 1.2380, hold firm.
For traders, a break below the lower channel boundary might signal further downside to key levels around 1.2300, while a bullish reversal would require a breach of the upper channel and sustained movement above 1.2550.
• DISCLAIMER: Please note that the above analysis is not an investment suggestion by “Capitalcore LLC”. This post has been published only for educational purposes.
Capitalcore


