Capitalcore
Member
UK100 Technical Analysis Before Breakout
The UK100, commonly referred to as the FTSE 100 Index or simply the "Footsie", represents the 100 largest companies listed on the London Stock Exchange by market capitalization. It serves as a key benchmark for the performance of major UK equities and is often influenced by both domestic economic indicators and global market trends. In today's fundamental outlook, attention turns to three key economic metrics released by the Bank of England: money supply, mortgage approvals, and consumer credit. All three are forward-looking indicators tied closely to consumer and business confidence. If today's figures surpass expectations, it would suggest improved economic momentum, supporting the GBP and potentially fueling further upside in the FTSE 100 through stronger corporate earnings expectations. However, any disappointment in these data points may pressure sentiment and dampen near-term price action on the UK100 daily chart.

Chart Notes:
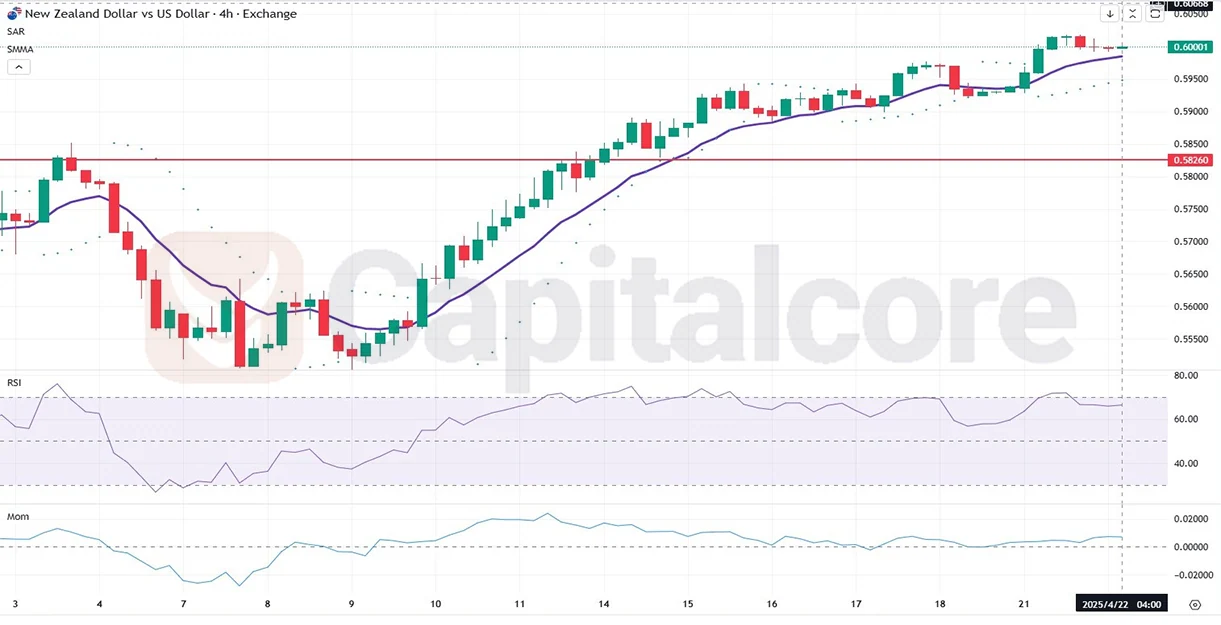
• Chart time-zone is UTC (+02:00)
• Candles’ time-frame is 4h.
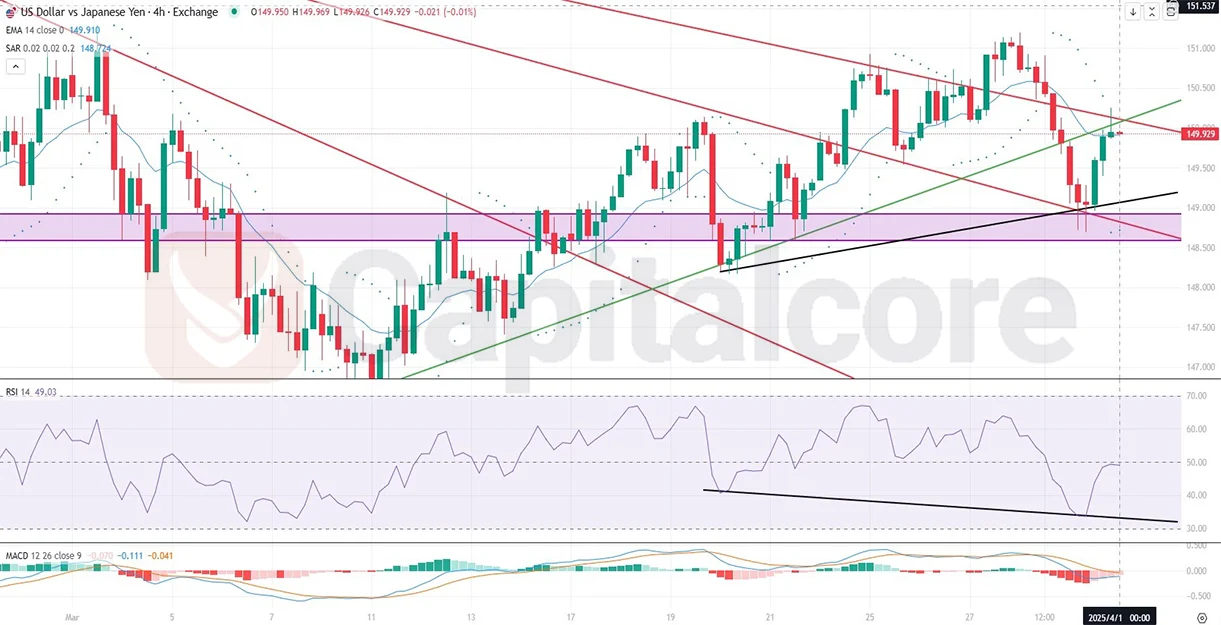
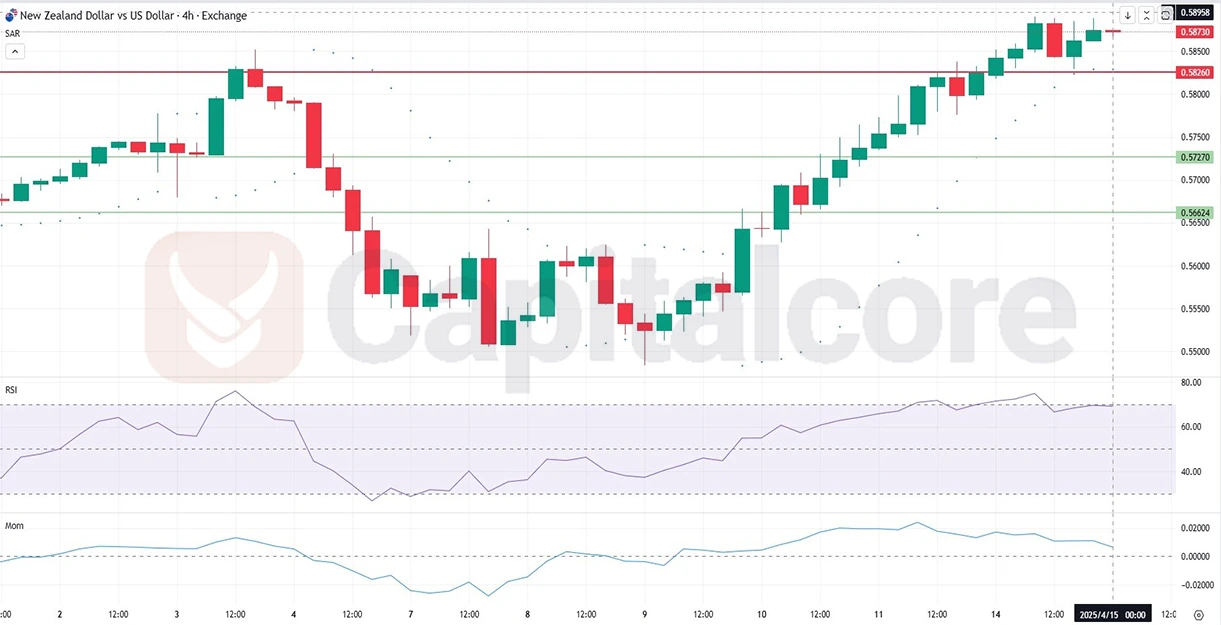
From a technical perspective, the UK100 H4 chart reveals a classic symmetrical triangle pattern, indicating a period of consolidation following an earlier bullish move. Currently, the price is hovering near the ascending trendline support, suggesting a potential bounce—especially if it holds. A breakout above the descending resistance line could signal a continuation of the prior uptrend. The Parabolic SAR shows the last four dots forming below the candles, a bullish signal indicating potential upward momentum. The RSI (Relative Strength Index) sits at around 45.71, showing a neutral to slightly bearish stance, yet not oversold, leaving room for a rebound. Meanwhile, the MACD (Moving Average Convergence Divergence) shows a slight bearish crossover, indicating weakened momentum but not an aggressive downtrend. Traders should closely monitor the price reaction around the triangle's lower trendline and watch for a breakout confirmation in either direction on this UK100 H4 price action setup.
• DISCLAIMER: Please note that the above analysis is not an investment suggestion by “Capitalcore LLC”. This post has been published only for educational purposes.
Capitalcore
The UK100, commonly referred to as the FTSE 100 Index or simply the "Footsie", represents the 100 largest companies listed on the London Stock Exchange by market capitalization. It serves as a key benchmark for the performance of major UK equities and is often influenced by both domestic economic indicators and global market trends. In today's fundamental outlook, attention turns to three key economic metrics released by the Bank of England: money supply, mortgage approvals, and consumer credit. All three are forward-looking indicators tied closely to consumer and business confidence. If today's figures surpass expectations, it would suggest improved economic momentum, supporting the GBP and potentially fueling further upside in the FTSE 100 through stronger corporate earnings expectations. However, any disappointment in these data points may pressure sentiment and dampen near-term price action on the UK100 daily chart.
Chart Notes:
• Chart time-zone is UTC (+02:00)
• Candles’ time-frame is 4h.
From a technical perspective, the UK100 H4 chart reveals a classic symmetrical triangle pattern, indicating a period of consolidation following an earlier bullish move. Currently, the price is hovering near the ascending trendline support, suggesting a potential bounce—especially if it holds. A breakout above the descending resistance line could signal a continuation of the prior uptrend. The Parabolic SAR shows the last four dots forming below the candles, a bullish signal indicating potential upward momentum. The RSI (Relative Strength Index) sits at around 45.71, showing a neutral to slightly bearish stance, yet not oversold, leaving room for a rebound. Meanwhile, the MACD (Moving Average Convergence Divergence) shows a slight bearish crossover, indicating weakened momentum but not an aggressive downtrend. Traders should closely monitor the price reaction around the triangle's lower trendline and watch for a breakout confirmation in either direction on this UK100 H4 price action setup.
• DISCLAIMER: Please note that the above analysis is not an investment suggestion by “Capitalcore LLC”. This post has been published only for educational purposes.
Capitalcore