Unitedpips
Member
USDJPY Technical Indicators Signal Potential Reversal

Introduction to USDJPY
The USD/JPY currency pair, often called "Gopher," represents the exchange rate between the U.S. dollar and the Japanese yen. As one of the most liquid and widely traded forex pairs, it reflects the economic and monetary dynamics between the United States and Japan. This pair is highly responsive to interest rate decisions, inflation data, and geopolitical developments, offering opportunities for both traders and investors.
USD JPY Market Overview
The USD/JPY pair is currently influenced by significant economic data and global sentiment. On the JPY side, the Bank of Japan's lending figures show moderate growth, reflecting cautious optimism in Japan’s economic activities. The Ministry of Finance's current account surplus points to strong export activity, supporting the yen. Additionally, Japan’s Final GDP Price Index and Eco Watchers Sentiment indicate stable but slow economic recovery. On the USD side, Final Wholesale Inventories released today could drive volatility, with lower-than-expected figures potentially weakening the dollar. Traders are keenly watching how these mixed signals will shape the USDJPY pair's direction, especially as it navigates critical support and resistance levels.

USD/JPY Technical Analysis
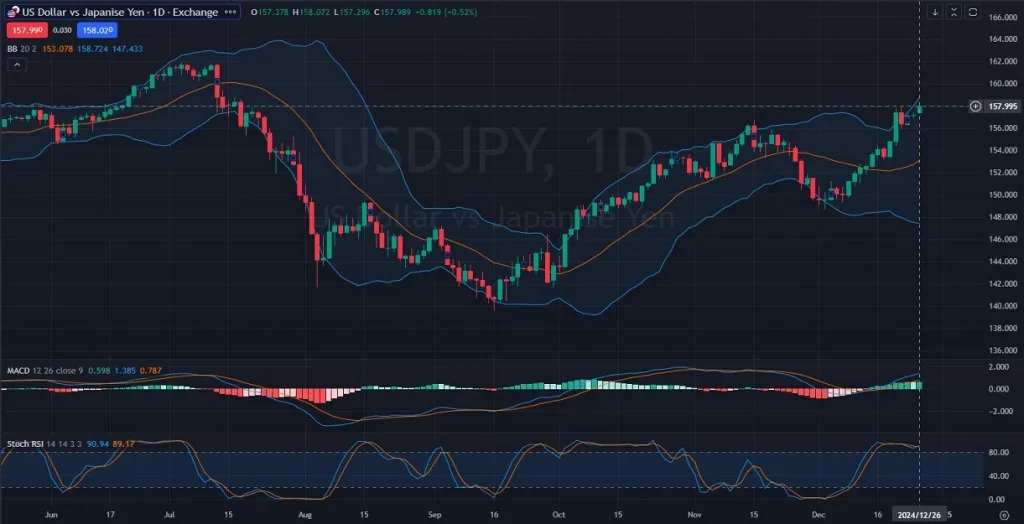
On the daily USD/JPY chart, the price has recently entered the Ichimoku Cloud from the top, indicating potential weakness in the bullish trend. The Ichimoku components reveal resistance at Span A, with Span B acting as a broader support level within the cloud. The Parabolic SAR (yellow crosses) above the candles suggests a bearish reversal, while the RSI is hovering near 40, indicating mild bearish momentum without being oversold. Meanwhile, the MACD shows a bearish crossover, further supporting a downtrend bias. If the price continues within the cloud, we could see consolidation, but a break below the lower boundary may signal stronger bearish momentum.
Final Words About USD vs JPY
The USD JPY pair appears to be at a pivotal point, with bearish signals gaining traction on the technical front. However, the direction will depend on how the economic data unfolds today. If Japan’s positive economic sentiment continues and the U.S. releases weaker-than-expected wholesale inventory data, the yen may gain strength against the dollar. Traders should watch the Ichimoku Cloud boundaries and MACD for confirmation of trend direction while keeping an eye on upcoming U.S. and Japanese economic announcements. Risk management remains critical, as any surprises in the data could lead to rapid price movements.
12.09.2024

Introduction to USDJPY
The USD/JPY currency pair, often called "Gopher," represents the exchange rate between the U.S. dollar and the Japanese yen. As one of the most liquid and widely traded forex pairs, it reflects the economic and monetary dynamics between the United States and Japan. This pair is highly responsive to interest rate decisions, inflation data, and geopolitical developments, offering opportunities for both traders and investors.
USD JPY Market Overview
The USD/JPY pair is currently influenced by significant economic data and global sentiment. On the JPY side, the Bank of Japan's lending figures show moderate growth, reflecting cautious optimism in Japan’s economic activities. The Ministry of Finance's current account surplus points to strong export activity, supporting the yen. Additionally, Japan’s Final GDP Price Index and Eco Watchers Sentiment indicate stable but slow economic recovery. On the USD side, Final Wholesale Inventories released today could drive volatility, with lower-than-expected figures potentially weakening the dollar. Traders are keenly watching how these mixed signals will shape the USDJPY pair's direction, especially as it navigates critical support and resistance levels.

USD/JPY Technical Analysis
On the daily USD/JPY chart, the price has recently entered the Ichimoku Cloud from the top, indicating potential weakness in the bullish trend. The Ichimoku components reveal resistance at Span A, with Span B acting as a broader support level within the cloud. The Parabolic SAR (yellow crosses) above the candles suggests a bearish reversal, while the RSI is hovering near 40, indicating mild bearish momentum without being oversold. Meanwhile, the MACD shows a bearish crossover, further supporting a downtrend bias. If the price continues within the cloud, we could see consolidation, but a break below the lower boundary may signal stronger bearish momentum.
Final Words About USD vs JPY
The USD JPY pair appears to be at a pivotal point, with bearish signals gaining traction on the technical front. However, the direction will depend on how the economic data unfolds today. If Japan’s positive economic sentiment continues and the U.S. releases weaker-than-expected wholesale inventory data, the yen may gain strength against the dollar. Traders should watch the Ichimoku Cloud boundaries and MACD for confirmation of trend direction while keeping an eye on upcoming U.S. and Japanese economic announcements. Risk management remains critical, as any surprises in the data could lead to rapid price movements.
12.09.2024


