What's new

Forex News Daily Market Analysis By FXOpen

4.00 star(s) 11 Votes
XRPUSD Analysis: Bearish Harami Pattern Is below $0.4869


Last week, the market sentiment remained indecisive after Ripple touched a high of $0.4869 on April 28 and started to correct downwards. The market opened bearish this week.

On the hourly chart:

  • The relative strength index is at 44.35, which signifies a weak demand for Ripple at the current prices and the continuation of the bearish phase in the market.
  • Moving averages signal a downward price movement at the current market level of 0.4626.
  • The STOCHRSI is in the oversold zone, which means the price is expected to correct upwards.
  • Ripple is now trading just below its pivot level of 0.4634 and is facing its classic support at 0.4577 and Fibonacci support at 0.4597, after which it may move towards 0.4500.
  • We have seen a bearish opening of the market.
  • Ripple is trading in a contracting range below $0.4700.

Some of the major technical indicators are bearish.

  • Ripple bearish reversal is seen below 0.4869.
  • The price is below its pivot level.
  • Average true range indicates low volatility.
  • The price is below the Ichimoku cloud, indicating a bearish trend.

The MACD indicator formed a bearish divergence in the 15-minute timeframe.


VIEW FULL ANALYSIS VISIT - FXOpen Blog...

Disclaimer: This Forecast represents FXOpen Companies opinion only, it should not be construed as an offer, invitation or recommendation in respect to FXOpen Companies products and services or as Financial Advice.
 
EUR/USD Restarts Increase While USD/JPY Corrects After Rally


EUR/USD started a fresh increase above the 1.1000 resistance. USD/JPY rallied significantly above 137.00 and recently started a downside correction.

Important Takeaways for EUR/USD and USD/JPY

  • The Euro is rising and gaining pace above the 1.1000 resistance zone.
  • There was a break above a key bearish trend line with resistance near 1.1000 on the hourly chart of EUR/USD at FXOpen.
  • USD/JPY started a major rally above the 136.00 and 137.00 levels.
  • There was a break below a key bullish trend line with support near 137.45 on the hourly chart at FXOpen.

EUR/USD Technical Analysis


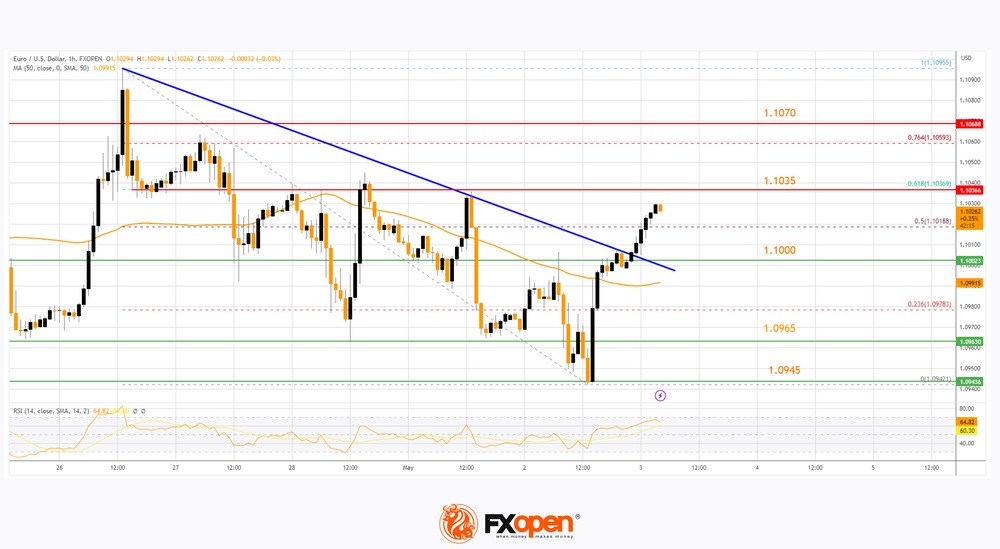
On the hourly chart of EUR/USD at FXOpen, the pair formed a base above the 1.0945 level. The Euro started a fresh increase above the 1.0965 resistance against the US Dollar.

There was a move above a key bearish trend line with resistance near 1.1000 and the 50-hour simple moving average. The pair is now trading above the 50% Fib retracement level of the downward move from the 1.1095 swing high to the 1.0972 low.

It is now facing resistance near the 61.8% Fib retracement level of the downward move from the 1.1095 swing high to the 1.0972 low at 1.1035.

The next major resistance is near the 1.1070 level. An upside break above 1.1070 could set the pace for another increase considering the hourly RSI is positioned nicely above 50. In the stated case, the pair might visit 1.1120. Any more gains might send the pair towards 1.1150.

If not, EUR/USD might start another decline from 1.1035. Initial support sits near the 1.1000 level. The first major support is near the 1.0965 level, below which the pair could start a major decline. In the stated case, the pair might dive toward the 1.0880 support zone.

VIEW FULL ANALYSIS VISIT - FXOpen Blog...

Disclaimer: This Forecast represents FXOpen Companies opinion only, it should not be construed as an offer, invitation or recommendation in respect to FXOpen Companies products and services or as Financial Advice.
 
Brent Analysis: Crude Oil Is at Lowest Point in Over a Month as US Economy Teeters and Supply Changes


Over the past year, the price of crude oil has been interestingly volatile.

In keeping with other periods in modern history during which the United States has been involved in geopolitical conflicts with regions outside of the Western world, oil prices have been varying with verve and vigour since 2020.

Back in the 1970s, the famous' oil crisis' was caused by members of the OPEC oil-producing nations in the Middle East invoking a trade embargo against the United States following the 1973 Yom Kippur War, which took place between the State of Israel and some of its neighbours.

The result was extremely high oil prices across Western nations, particularly the United States, due to a lack of supply that could not meet the demand and fuel-saving measures such as the introduction of a 55-mile-per-hour speed limit for motor vehicles.

Due to its nature as a consumable commodity, oil is not only a tradeable asset but also an energy product, and the oil-producing nations can use it as a bargaining tool on the political table.

Over the past year, the price of crude oil has varied dramatically due to the trade sanctions placed on the Russian Federation by North American and European nations, which have meant that Russian oil companies have not been able to access their bank accounts in which oil supply is usually settled in such nations, hence the need for Western customers to settle directly in rubles to bank accounts in Russia, or to have to face restricted supplies.

More recently, just one month ago, Saudi Arabian oil giants reported that they intended to scale back oil production by as much as 500,000 barrels per day in an effort to bolster oil prices as part of a large-scale attempt by OPEC+ nations.

The status quo has now largely been accepted, and oil supply has been generally steady worldwide, with price fluctuations now part of the trading landscape and the everyday reality for consumers.

In Britain, the government introduced a 'cost of living allowance,' payable to many members of the public, in order to assist with the ongoing cost of living crisis, in which the cost of fuel to heat homes or drive to work are both important factors.

This week, however, the price of oil has dropped significantly. Brent Crude took a sudden dive in price yesterday from $77.03 per barrel at 8.30 am during the European trading session to $73.60 during the night.

VIEW FULL ANALYSIS VISIT - FXOpen Blog...


Disclaimer: This Forecast represents FXOpen Companies opinion only, it should not be construed as an offer, invitation or recommendation in respect to FXOpen Companies products and services or as Financial Advice.
 
ETHUSD Analysis: Bullish Engulfing Pattern above $1,805


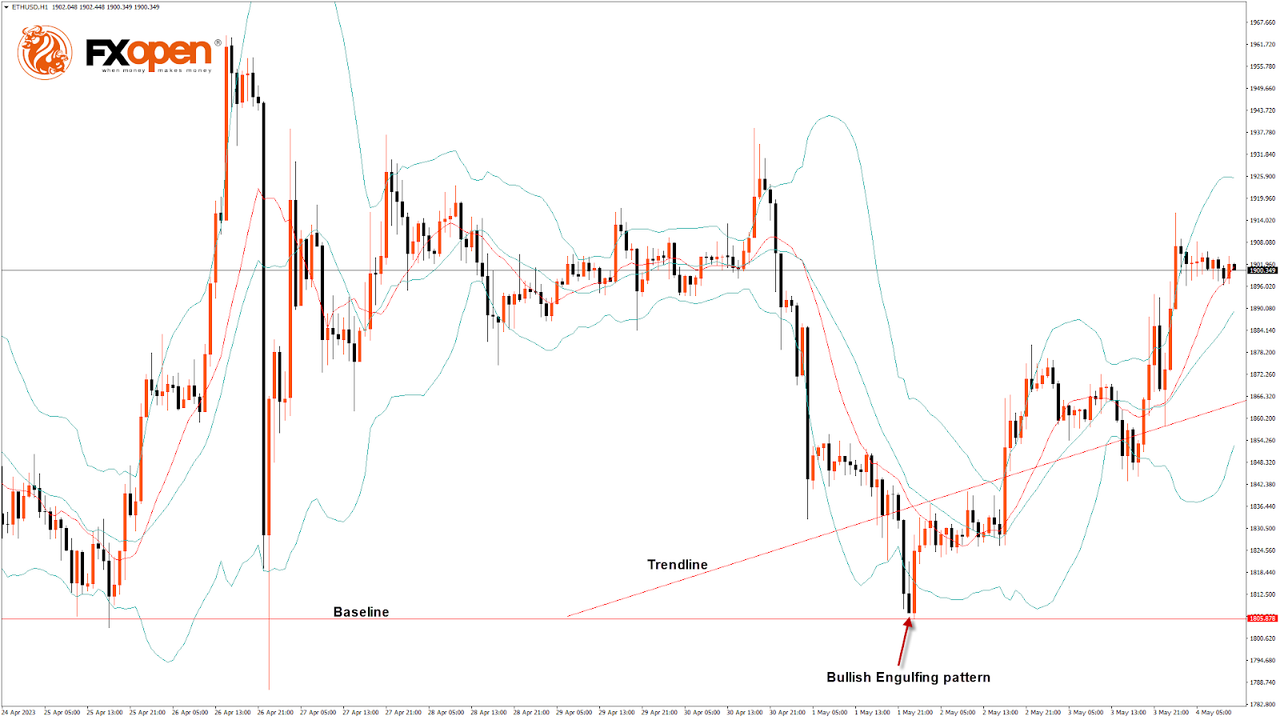
Bulls were able to take control of the market, and after touching a low of $1,805 on May 1, the ETH/USD pair moved upwards, touching a high of $1,916 today in the early Asian trading session. The bullish engulfing pattern is above the $1,805 handle on the H1 timeframe. It's a bullish pattern, which signifies the end of a bearish phase.

The market opened bullish this week. The ETH price remains well supported above the $1,800 level and is back above the pivot point.

The relative strength index is at 61.03, indicating a strong demand for Ether and a continuation of the buying pressure in the market.

Both the STOCH and CCI are neutral, meaning that the price is expected to enter into a consolidation zone in the short-term range.

A bullish reversal pattern with the 50-period moving average in the 2-hour timeframe was formed.

Most of the technical indicators are bullish. Most moving averages are bullish at the current Ethereum price of $1,899.

ETH is now trading above the 100-hour simple and 200-hour exponential moving averages.

  • ETH price is showing a bullish reversal above the $1,805 mark.
  • The short-term range is expected to be mildly bullish.
  • The average true range indicates low market volatility.
  • The ETH price ranges near the support of the channel.


VIEW FULL ANALYSIS VISIT - FXOpen Blog...

Disclaimer: This Forecast represents FXOpen Companies opinion only, it should not be construed as an offer, invitation or recommendation in respect to FXOpen Companies products and services or as Financial Advice.
 
LTCUSD Analysis: The Morning Star Pattern Is above $85.16


Bulls were able to take control of the market last week, and after touching a low of $85.16 on May 1, the price started to correct upwards against the US dollar, touching a high of $89.82 today in the early Asian trading session.

There is a morning star pattern above the $85.16 handle on the H1 timeframe. It signifies the end of a bearish phase and the start of a bullish phase in the market.

The momentum indicator is back over zero in the H4 timeframe, indicating a bullish trend.

A bullish harami pattern is forming in the 30-minute timeframe.

Also, Litecoin is trading below its 100-hour simple moving average and 200-hour exponential moving average and above its pivot level of $88.5.

The relative strength index is at 51.92, indicating a neural demand for Litecoin and the shift towards consolidation.

Litecoin price remains above some of the moving averages, which are giving a bullish signal at current market levels of $88.20.

Both the ADX and CCI are signaling neutral market conditions, which means that the price is expected to move in a narrow range in the short term.

The short-term outlook for Litecoin has turned mildly bullish.

  • Some of the technical indicators are bullish.
  • Litecoin bullish reversal is seen above the $85.16 level.
  • The RSI is neutral.
  • The average true range indicates low market volatility.


VIEW FULL ANALYSIS VISIT - FXOpen Blog...

Disclaimer: This Forecast represents FXOpen Companies opinion only, it should not be construed as an offer, invitation or recommendation in respect to FXOpen Companies products and services or as Financial Advice.
 
AUD/USD and NZD/USD Target Additional Gains


AUD/USD is moving higher and might climb further higher above 0.6740. NZD/USD is also rising and might rally above the 0.6310 resistance zone.

Important Takeaways for AUD USD and NZD USD Analysis Today

  • The Aussie Dollar started a fresh increase above the 0.6670 and 0.6700 levels against the US Dollar.
  • There was a break above a major contracting triangle with resistance near 0.6700 on the hourly chart of AUD/USD at FXOpen.
  • NZD/USD is gaining bullish momentum above the 0.6260 support.
  • There is a key bullish trend line forming with support near 0.6260 on the hourly chart of NZD/USD at FXOpen.

AUD/USD Technical Analysis


On the hourly chart of AUD/USD at FXOpen, the pair started a fresh increase from the 0.6640 support. The Aussie Dollar was able to clear the 50-hour simple moving average to move into a positive zone against the US Dollar.

There was also a break above a major contracting triangle with resistance near 0.6700 and the 76.4% Fib retracement level of the downward move from the 0.6717 swing high to the 0.6641 low.

The AUD USD chart indicates that the pair is now consolidating near the 1.236 Fib extension of the downward move from the 0.6717 swing high to the 0.6641 low. On the upside, it is facing resistance near the 0.6740 level.

An upside break above the 0.6740 resistance might send the pair further higher. The next major resistance is near the 0.6780 level. Any more gains could open the doors for a move toward the 0.6840 resistance zone.

On the downside, initial support is near 0.6740. The next support could be the 0.6670 level and the 50-hour simple moving average. If there is a downside break below the 0.6670 support, the pair could extend its decline toward the 0.6640 level. Any more losses might signal a move toward 0.6580.

VIEW FULL ANALYSIS VISIT - FXOpen Blog...

Disclaimer: This Forecast represents FXOpen Companies opinion only, it should not be construed as an offer, invitation or recommendation in respect to FXOpen Companies products and services or as Financial Advice.
 
Watch FXOpen's May 1 - 5 Weekly Market Wrap Video

In this video, FXOpen UK COO Gary Thomson sums up the week’s happenings and discusses the most significant news reports.

  • Unexpected interest rate hike in Australia strengthens AUD
  • Market reaction to the Fed's decision
  • Crude oil is at lowest point in over a month as US economy teeters and supply changes
  • The Netflix chill – shares hit one-month low over past few days

Watch our short and informative video, and stay updated with FXOpen.


FXOpen YouTube


Disclaimer: This forecast represents FXOpen Companies opinion only, it should not be construed as an offer, invitation or recommendation in respect to FXOpen Companies products and services or as financial advice.

#fxopen #fxopenyoutube #fxopenuk #weeklyvideo
 
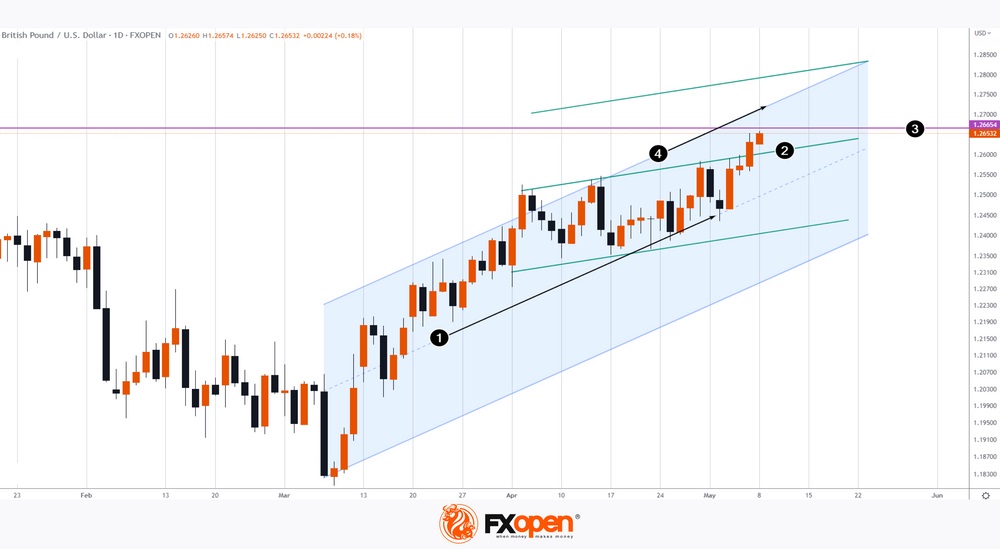
GBP/USD Reaches High Since the Beginning of the Year


Today, the British pound has updated its maximum since the beginning of the year. Here are the factors that contributed to this:

→ weakness of the US dollar due to the threat of default. The FT relays Yellen's words that the US Treasury Department's ability to bypass the default is running out;

→ the US dollar's weakness due to the banking crisis. According to media reports, 722 US banks have unrealized losses of more than 50% of capital;

→ the upcoming meeting of the Bank of England (Thursday, at 14:00 GMT+3). A rate increase is expected, which may not be the last.


VIEW FULL ANALYSIS VISIT - FXOpen Blog...

Disclaimer: This Forecast represents FXOpen Companies opinion only, it should not be construed as an offer, invitation or recommendation in respect to FXOpen Companies products and services or as Financial Advice.
 
GBP/USD Eyes Bullish Breakout While EUR/GBP Consolidates Losses


GBP/USD is gaining bullish momentum above the 1.2600 resistance zone. EUR/GBP is now consolidating losses below the 0.8740 resistance.

Important Takeaways for GBP/USD and EUR/GBP Analysis Today

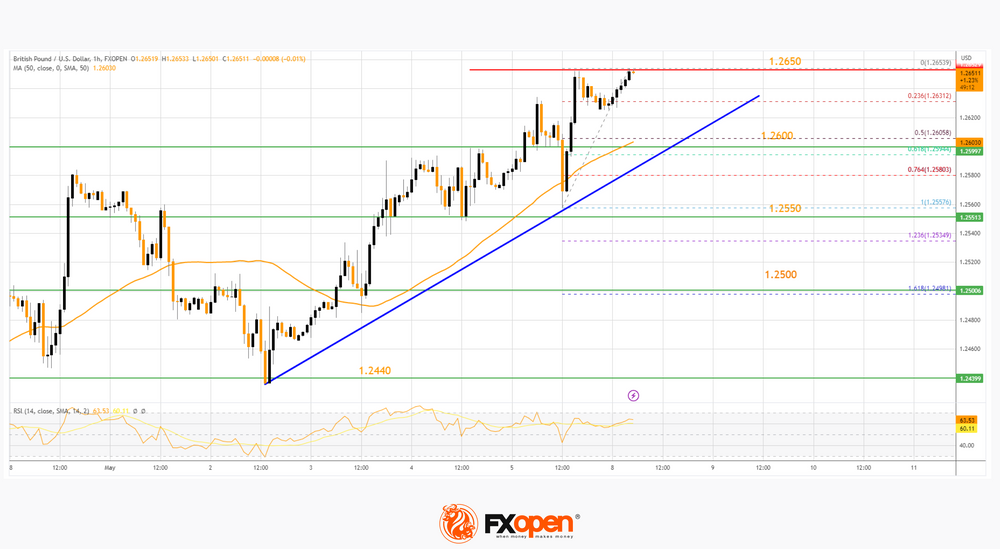
  • The British Pound is showing a lot of bullish signs above the 1.2600 pivot level against the US Dollar.
  • There is a key bullish trend line forming with support near 1.2600 on the hourly chart of GBP/USD at FXOpen.
  • EUR/GBP started a fresh decline from the 0.8835 resistance zone.
  • There is a major bearish trend line forming with resistance near 0.8740 on the hourly chart at FXOpen.

GBP/USD Technical Analysis


On the hourly chart of GBP/USD at FXOpen, the pair found support near the 1.2440 zone. The British Pound started a decent increase above the 1.2500 resistance against the US Dollar.

The pair gained bullish momentum above the 1.2550 resistance and climbed above the 50-hour simple moving average. A high is formed near 1.2653 and the pair is now consolidating gains above the 23.6% Fib retracement level of the upward move from the 1.2557 swing low to the 1.2653 high.

On the downside, there is a major support forming near the 50-hour simple moving average at 1.2600. There is also a key bullish trend line forming along with the 50% Fib retracement level of the upward move from the 1.2557 swing low to the 1.2653 high.

If there is a downside break below the 1.2600 support, the pair could accelerate lower. The next major support is near the 1.2550 level, below which the pair could test 1.2500. In the stated case, GBP/USD may perhaps revisit the 1.2440 support. Any more losses could lead the pair toward the 1.2350 support.

On the upside, resistance is near the 1.2650 zone. The next major resistance is near the 1.2700 level. A clear move above the 1.2700 level could spark a rally toward the 1.2840 level considering the current RSI position on the GBP/USD chart.

VIEW FULL ANALYSIS VISIT - FXOpen Blog...

Disclaimer: This Forecast represents FXOpen Companies opinion only, it should not be construed as an offer, invitation or recommendation in respect to FXOpen Companies products and services or as Financial Advice.
 
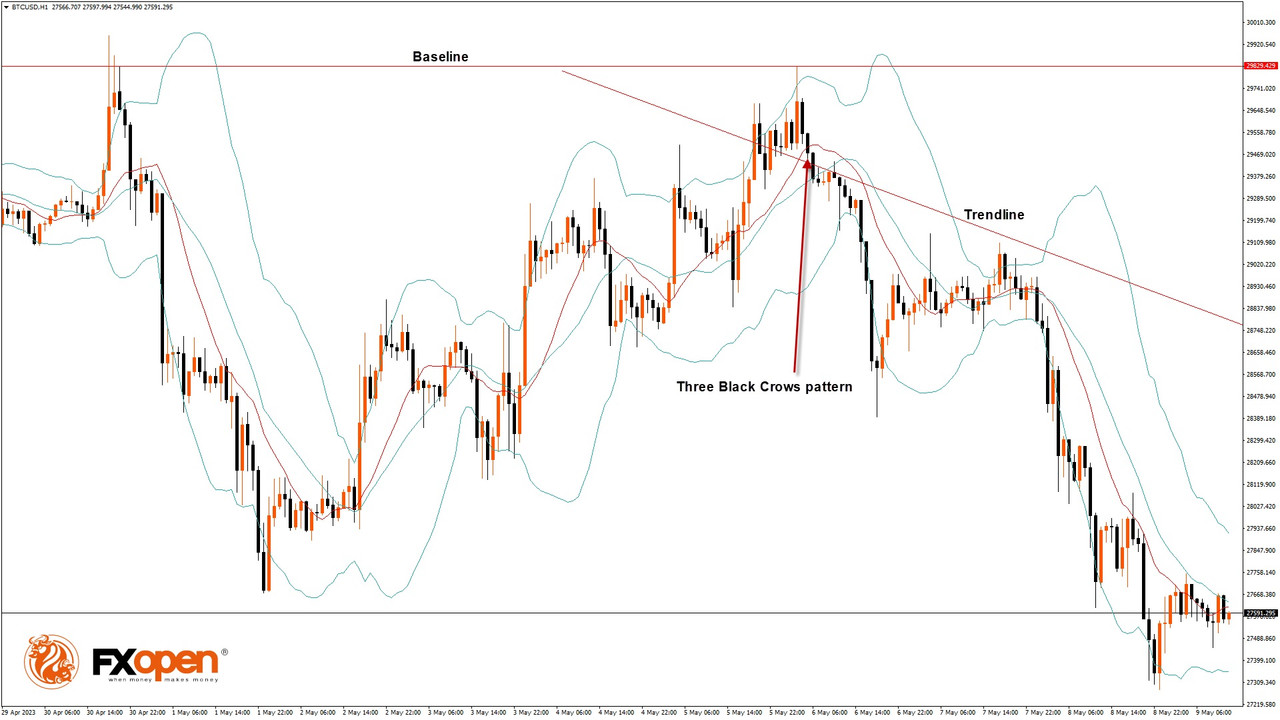
BTCUSD Analysis: Three Black Crows Pattern below $29,829


Bitcoin was unable to continue its bullish momentum from last week, and after touching a high of $29,829 on May 06, we can see a continuous decline in the bitcoin price, with immediate targets located in the range of $26500 and $27000.

We can clearly see a bearish three black crows pattern below the $29,829 handle on the H1 timeframe.

The price of Bitcoin continues to move in a bearish momentum, which is expected to continue towards the $27,000 handle.

Both the STOCH and Williams’s percent range indicate overbought levels, which means that in the immediate short term, a decline in the price is expected.

The Bitcoin chart is ranging near a new record low for 1 month.

The relative strength index is at 39.90, indicating a very weak demand for Bitcoin and the continuation of the selling pressure in the markets.

Bitcoin is now moving below its 100-hour exponential moving average and below its 200-hour exponential moving average.

Most of the major technical indicators are giving a bearish signal, which means that in the immediate short term, we are expecting targets of $26,500 and $27,000.

The average true range indicates less market volatility with mild bearish momentum.

  • Bitcoin bearish reversal is seen below $29,829.
  • The RSI remains below 50, indicating a bearish market.
  • The price is now trading below its pivot level of $27,622.
  • The short-term range is mildly bearish.
  • The momentum indicator is back under zero.


VIEW FULL ANALYSIS VISIT - FXOpen Blog...

Disclaimer: This Forecast represents FXOpen Companies opinion only, it should not be construed as an offer, invitation or recommendation in respect to FXOpen Companies products and services or as Financial Advice.
 
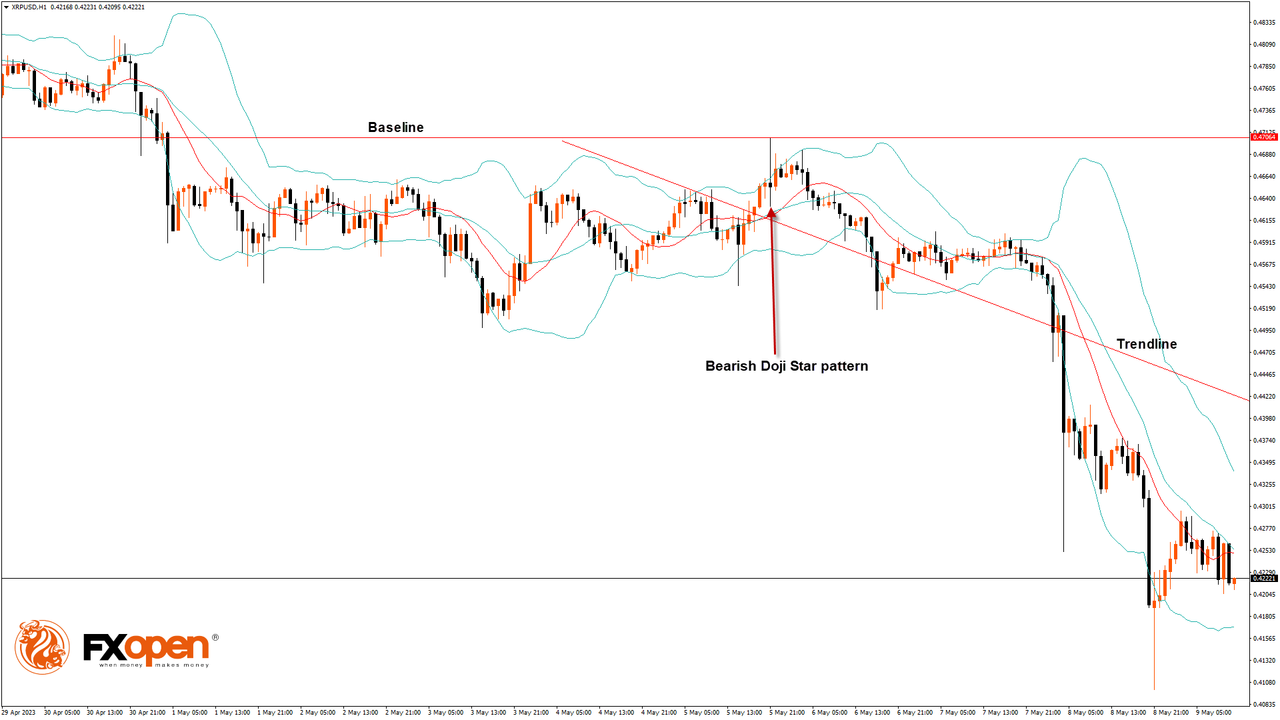
XRPUSD Analysis: Bearish Doji Star Pattern below $0.4706


Ripple was unable to continue its bullish momentum from last week, and after touching a high of $0.4706 on May 05, we can see a continuous decline in the Ripple price, with immediate targets located in the range of $0.4000 and $0.3800.

On the hourly chart:

  • The relative strength index is at 39.25, which signifies a very weak demand for Ripple at the current market prices and the continuation of the bearish phase in the market.
  • Moving averages signal a downward price movement at the current market level of 0.4236.
  • The Ultimate oscillator is in the neutral zone, which means the price is expected to consolidate further.
  • Ripple is now trading just above its pivot level of 0.4229 and is facing its classic support at 0.4153 and facing Fibonacci support at 0.4211, after which it will be able to move towards 0.4000.
  • The markets opened bearish this week.
  • Ripple to USD exchange rate is ranging near a new record low for one month.

Some of the major technical indicators are bearish.

  • Ripple bearish reversal is seen below 0.4706.
  • The price is just above its pivot level.
  • Average true range indicates less volatility.
  • RSI is back under 50.
  • Ichimoku price is under the cloud, indicative of the bearish pressure.

We have also detected the formation of bearish engulfing lines in the 4-hourly timeframe.


VIEW FULL ANALYSIS VISIT - FXOpen Blog...

Disclaimer: This Forecast represents FXOpen Companies opinion only, it should not be construed as an offer, invitation or recommendation in respect to FXOpen Companies products and services or as Financial Advice.
 
EUR/USD Dips Again While USD/CHF Turns At Risk of Fresh Decline


EUR/USD started a fresh decline from the 1.1050 resistance. USD/CHF is moving lower and might decline further toward the 0.8860 support.

Important Takeaways for EUR/USD and USD/CHF Analysis Today

  • The Euro started a fresh decline from the 1.1050 resistance against the US Dollar.
  • There is a major bearish trend line forming with resistance near 1.1000 on the hourly chart of EUR/USD at FXOpen.
  • USD/CHF is showing a few bearish signs below the 0.8930 resistance zone.
  • There is a key bearish trend line forming with resistance near 0.8925 on the hourly chart at FXOpen.

EUR/USD Technical Analysis


On the hourly chart of EUR/USD at FXOpen, the pair faced rejection near the 1.1050 level. The Euro started a fresh decline from the 1.1053 high against the US Dollar.

There was a move below the 50-hour simple moving average at 1.1000. The pair tested the 1.0945 support. A low is formed near 1.0941 and the pair is now correcting losses. There was a recovery wave above the 23.6% Fib retracement level of the recent decline from the 1.1053 swing high to the 1.0941 low.

The first major resistance is near the 50-hour simple moving average at 1.1000. It coincides with a major bearish trend line and the 50% Fib retracement level of the recent decline from the 1.1053 swing high to the 1.0941 low.

An upside break above the 1.1000 level might send the pair toward the 1.1050 resistance. The next major resistance is near the 1.1090 level. Any more gains might open the doors for a move toward the 1.1120 level.

If there is no move above 1.1050, the pair might start a fresh decline. On the downside, immediate support on the EUR/USD chart is seen near 1.0945.

The next major support is near the 1.0920 level. A downside break below the 1.0920 support could start a steady decline toward the 1.0865 level.

VIEW FULL ANALYSIS VISIT - FXOpen Blog...

Disclaimer: This Forecast represents FXOpen Companies opinion only, it should not be construed as an offer, invitation or recommendation in respect to FXOpen Companies products and services or as Financial Advice.
 
Ripple: News, Token Price Analysis


At the Fintech Summit in Dubai, Ripple CEO Brad Garlinghouse revealed the amount that Ripple has spent to defend itself in a legal dispute with the US Securities and Exchange Commission (SEC). He said:

“With the SEC, [...] by the time all’s said and done, we will have spent $200 million defending ourselves against a lawsuit, which from its very beginning, people were like, well, this doesn’t make a lot of sense.”

According to Brad, attempts to regulate cryptocurrencies in the US have come to a standstill, and therefore Ripple is considering expanding in Dubai, where laws are loyal to cryptocurrencies.

On March 9, we assumed that the price of Ripple could show strong dynamics amid expectations of a resolution of the conflict with the SEC — and yes, on March 29, the price of the XRP token in USD set a maximum since the beginning of the year. However, the conflict remained unresolved, and the bitcoin market is showing signs of weakness around the psychological USD 30k mark.


VIEW FULL ANALYSIS VISIT - FXOpen Blog...

Disclaimer: This Forecast represents FXOpen Companies opinion only, it should not be construed as an offer, invitation or recommendation in respect to FXOpen Companies products and services or as Financial Advice.

 
ETHUSD Analysis: Bearish Engulfing Pattern Is below $1,972


Bulls couldn’t take control of the market, and after touching a high of $1,972 on 06 May, the ETH/USD pair is moving in a bearish trend, touching a low of $1,792 on 10 May.

ETH/USD is under mild bearish pressure after its decline below the $1,850 handle, with immediate targets of $1,800 and $1,750 visible in the H1 timeframe.

The bearish engulfing pattern is below the $1,972 handle, signifying the end of a bullish phase.

The relative strength index is at 36.51, indicating very weak demand for Ether and a continuation of the selling pressure in the market.

Both the STOCHRSI and Williams %R are signalling the ETH is oversold, meaning that the Ethereum price is expected to correct upwards in the short-term range.

ETH price is now trading below 100-hour simple and 200-hour exponential moving averages.

  • ETH price bearish reversal is seen below the $1,972 mark.
  • The short-term range is expected to be mildly bearish.
  • The average true range indicates low market volatility.
  • The CCI indicator formed a bearish divergence with the price chart.


VIEW FULL ANALYSIS VISIT - FXOpen Blog...

Disclaimer: This article represents the opinion of the Companies operating under the FXOpen brand only. It is not to be construed as an offer, solicitation, or recommendation with respect to products and services provided by the Companies operating under the FXOpen brand, nor is it to be considered financial advice.
 
LTCUSD Analysis: Hanging Man Pattern Is below $87.83


Bulls could not take control of the market last week, and after touching a high of $87.83 on 06 May, the price started to correct lower against the US dollar, touching a low of $77.17 on 10 May.

There is a hanging man pattern below the $87.83 handle on the H1 timeframe. It signifies the end of a bullish phase and the start of a bearish phase in the market.

The Litecoin price is back under the pivot point in the daily timeframe.

Also, Litecoin price is trading below its 100-hour simple moving average and 200-hour exponential moving average and just above its pivot level of $80.05.

The relative strength index is at 48.97, indicating a neural demand for Litecoin and the shift towards the consolidation zone in the markets.

Litecoin remains below most of the moving averages, which is a bearish signal at the current market level of $80.33.

The short-term outlook for Litecoin has turned mildly bearish.

  • Some of the technical indicators are bearish.
  • Litecoin price bearish reversal is seen below the $87.83 level.
  • The RSI is neutral.
  • The average true range indicates low market volatility.


VIEW FULL ANALYSIS VISIT - FXOpen Blog...

Disclaimer: This article represents the opinion of the Companies operating under the FXOpen brand only. It is not to be construed as an offer, solicitation, or recommendation with respect to products and services provided by the Companies operating under the FXOpen brand, nor is it to be considered financial advice.
 
Gold Price and Crude Oil Price Could Extend Losses


Gold price is moving lower below the $2,025 support. Crude oil price is correcting gains and might decline toward the $68.85 support.

Important Takeaways for Gold and Oil Prices Analysis Today

  • Gold price failed to clear the $2,060 resistance and corrected gains against the US Dollar.
  • It broke a key contracting triangle with support near $2,025 on the hourly chart of gold at FXOpen.
  • Crude oil prices are also moving lower below $72.00 and $71.50 levels.
  • There was a break below a major bullish trend line with support near $73.00 on the hourly chart of XTI/USD at FXOpen.

Gold Price Technical Analysis


On the hourly chart of Gold at FXOpen, the price traded to a new all-time high before it started a downside correction. The price declined below the $2,060 level to move into a bearish zone.

The last swing high was near $2,048 and the price is now trading below the 50-hour simple moving average. It traded below a key contracting triangle with support near $2,025. The price is now trading below the 61.8% Fib retracement level of the upward move from the $1,999 swing low to the $2,048 high.

Initial support on the downside is near the 76.4% Fib retracement level of the upward move from the $1,999 swing low to the $2,048 high at $2,010.

The first major support is near the $2,000 level. The main support sits near the $1,976 level. If there is a downside break below the $1,976 support, the price might decline heavily.

The next major support is near $1,955, below which the bulls could aim for a test of $1,932. On the upside, the bulls are facing resistance near the 50-hour simple moving average at $2,025. The next major resistance is near the $2,038 level.

An upside break above the $2,038 resistance could send Gold price toward $2,060. Any more gains may perhaps set the pace for an increase toward the $2,080 level.

VIEW FULL ANALYSIS VISIT - FXOpen Blog...

Disclaimer: This Forecast represents FXOpen Companies opinion only, it should not be construed as an offer, invitation or recommendation in respect to FXOpen Companies products and services or as Financial Advice.
 
Watch FXOpen's May 08 - 12 Weekly Market Wrap Video

In this video, FXOpen UK COO Gary Thomson sums up the week’s happenings and discusses the most significant news reports.

  • Unexpected interest rate hike in Australia strengthens AUD
  • In Forex, GBP/USD reaches a new high since the beginning of the year
  • FTSE 100 drops 108 points in 5 days despite strong pound
  • British pound flying high against US dollar as King Charles crowned
  • Will Amazon hit last month’s highs again in May?
  • S&P 500 reacts positively to declining inflation

Watch our short and informative video, and stay updated with FXOpen.


FXOpen YouTube


Disclaimer: This forecast represents FXOpen Companies opinion only, it should not be construed as an offer, invitation or recommendation in respect to FXOpen Companies products and services or as financial advice.

#fxopen #fxopenyoutube #fxopenuk #weeklyvideo
 
GBP/USD and USD/CAD Weekly Chart Outlook


GBP/USD started a steady increase above the key 1.1880 resistance. USD/CAD is consolidating and might rise further toward 1.4000.

Important Takeaways for GBP/USD and USD/CAD Analysis

  • The British Pound was able to clear the 1.1880 and 1.2000 resistance levels.
  • There was a break above a major bearish trend line with resistance near 1.2250 on the weekly chart of GBP/USD on FXOpen.
  • USD/CAD is facing strong resistance near the 1.3750 zone.
  • It is trading inside a key contracting triangle with resistance at 1.3750 on the weekly chart at FXOpen.

GBP/USD Technical Analysis


On the weekly chart of GBP/USD at FXOpen, the pair formed a base above the 1.1250 zone and started a steady increase. The British Pound broke the key 1.1880 resistance zone against the US Dollar to enter a positive zone.

There was a move above a major bearish trend line with resistance near 1.2250 and the 50-week simple moving average. The pair settled above the 50% Fib retracement level of the main decline from the 1.4249 swing high to the 1.0327 low.

The GBP/USD chart suggests that the pair is now facing resistance near the 61.8% Fib retracement level of the main decline from the 1.4249 swing high to the 1.0327 low at 1.2750.

A clear upside break above the 1.2750 resistance might send the pair toward the 1.3320 resistance. Any more gains might send GBP/USD toward the 1.4250 level.

On the downside, initial support is near the trend line zone and 1.2200. The next major support is near the 1.1880 level. If there is a break below 1.1880, the pair could extend its decline. The next key support is near the 1.1250 level. Any more losses might call for a retest of the 1.0325 support.

VIEW FULL ANALYSIS VISIT - FXOpen Blog...

Disclaimer: This Forecast represents FXOpen Companies opinion only, it should not be construed as an offer, invitation or recommendation in respect to FXOpen Companies products and services or as Financial Advice.
 
Crude Oil Analysis: Crude Oil Running on Empty


The price movements affecting crude oil have been fascinating over the past year and a half.

During the period in which many Western governments imposed lockdowns on their population, oil was trading at relatively high prices because of logistical and supply chain difficulties created by enforced stay-at-home orders, whilst nations in Asia such as India, Thailand and Japan continued as normal and required as much of the thick black stuff as possible to keep the wheels of industry turning.

Once the folly of lockdowns had tested the patience of most of the Western world and the powers that be could no longer carry them out, everything suddenly went back to normal, but supply chain disruptions continued as the 'work from home' phenomenon was difficult to curtail.

Prices remained relatively high. However, in the early months of 2022, many of the same countries that imposed lockdowns began to band together to enforce trade sanctions on the Russian Federation and its industry.

One of the largest industries in that particular country is oil extraction and refinement and the production of oil-based energy products.

Indeed, Russia is an OPEC+ nation and one of the largest producers and exporters of petrochemical products in the world.

These sanctions meant that Russian oil companies could not access their bank accounts in which settlement for oil supply is made; hence many European customers had to begin to settle the supply of oil by Russian companies by paying in Rubles into a bank account in Moscow or face having their supply curtailed.

This caused a rise in the price of crude oil and much of Europe to face an energy price crisis in which the cost of heating homes or running vehicles became astronomical.

Today, things are somewhat different. The price of crude oil is, compared to a year ago, on the floor.

In fact, it is very low compared to even one month ago, and over the five-day moving average until the end of trading on May 12, it is down considerably.

On May 2, we witnessed the lowest value of crude oil in over a year, and on May 12, the second lowest since May 2.

VIEW FULL ANALYSIS VISIT - FXOpen Blog...

Disclaimer: This Forecast represents FXOpen Companies opinion only, it should not be construed as an offer, invitation or recommendation in respect to FXOpen Companies products and services or as Financial Advice.
 

Create an account or login to comment

You must be a member in order to leave a comment

Create account

Create an account on our community. It's easy!

Log in

Already have an account? Log in here.

Members Online

No members online now.

Similar threads

Users Who Are Viewing This Thread (Total: 1, Members: 0, Guests: 1)

Top
AdBlock Detected

We get it, advertisements are annoying!

Sure, ad-blocking software does a great job at blocking ads, but it also blocks useful features of our website. For the best site experience please disable your AdBlocker.

I've Disabled AdBlock    No Thanks