What's new

Daily Market Analysis and Overview by Unitedpips

5.00 star(s) 1 Vote
Understanding GBP/USD Daily Price Action


Introduction to GBP/USD
The GBP-USD pair, known as "Cable," represents the exchange rate between the British Pound (GBP) and the US Dollar (USD). Historically, it is one of the oldest and most traded currency pairs globally. Traders closely watch this pair as it provides insights into economic strength and monetary policy divergence between the United Kingdom and the United States. Understanding movements in GBP/USD is crucial for forex traders and investors aiming to capitalize on exchange rate fluctuations.


GBPUSD Market Overview
GBP/USD currently exhibits a bullish sentiment, recently influenced by notable volatility due to crucial economic releases from both the UK and the US. Upcoming speeches by Federal Reserve officials, such as Patrick Harker and Raphael Bostic, will be critical as traders look for hints on future US monetary policy and potential interest rate adjustments. Recent positive data on UK Retail Sales and labor market strength, highlighted by improvements in unemployment claims and average earnings, have been beneficial for GBP. Conversely, strong USD movements may arise from positive outcomes in the US Import Price Index and New York Manufacturing Index. Traders should stay alert as further hawkish signals from the Fed might strengthen the USD temporarily, potentially impacting GBP/USD negatively in the short term.


GBP-USD Technical Analysis
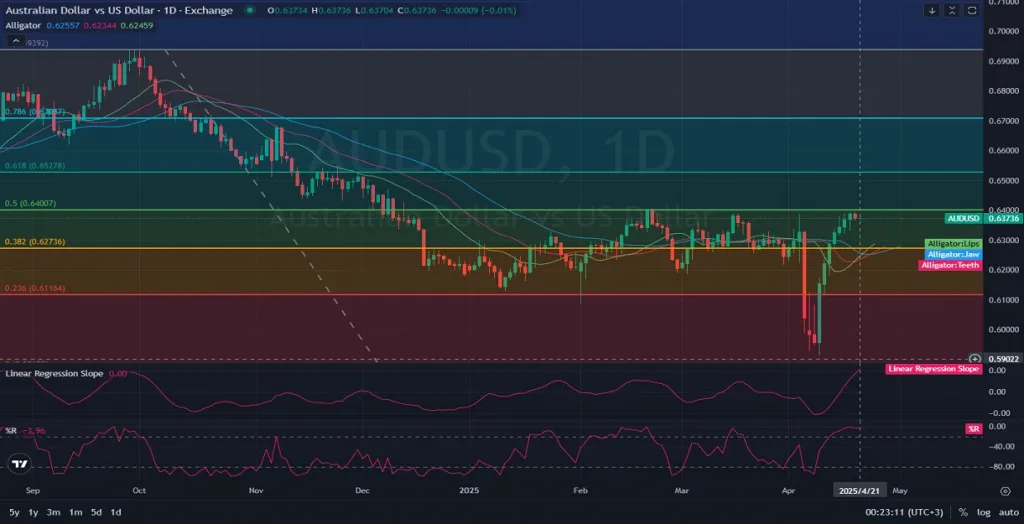
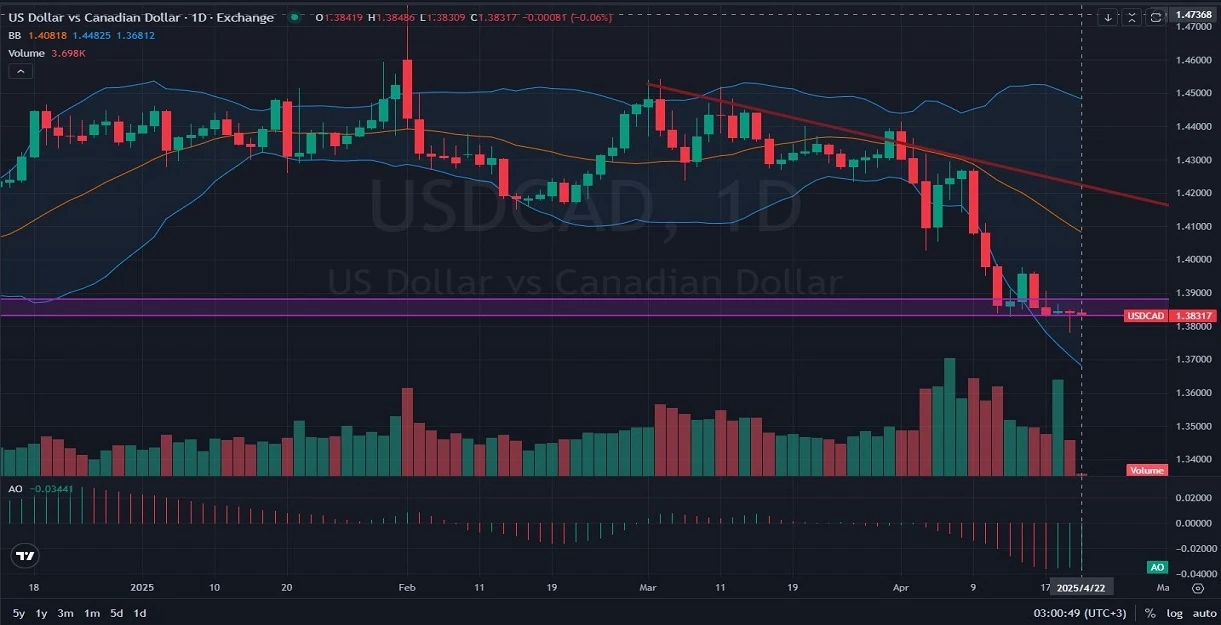
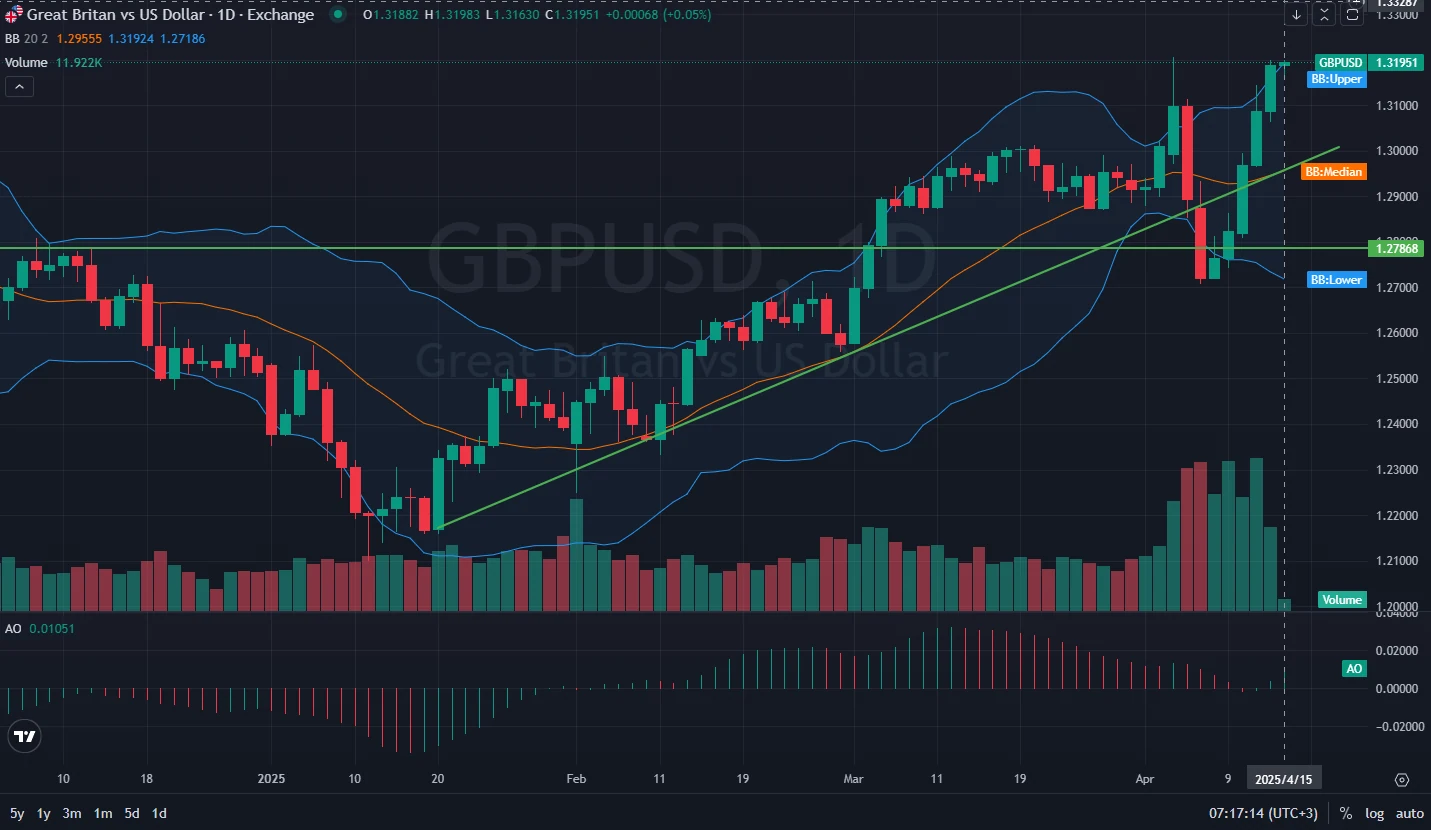
The daily chart shows GBP USD recently bounced strongly after a Breakout Failure (BOF) of the rising support trend line. After reacting to a lower horizontal support at around 1.2786, the pair rallied strongly and is now testing the previous high resistance at approximately 1.3184. Currently positioned near the upper Bollinger Band, GBP/USD may experience some downward correction in the short term, with initial support at the Bollinger upper line. Further potential targets in case of deeper correction include the Bollinger midline and the original trend support line. The Awesome Oscillator (AO) indicates bullish momentum but traders should watch closely for divergence signals, while trading volumes support recent bullish movements, suggesting robust buying interest.


Final Words about GBP vs USD
Considering the technical and fundamental outlook, GBPUSD appears poised to experience volatility with potential short-term corrections despite the ongoing bullish trend. Traders should closely monitor upcoming Federal Reserve speeches and UK economic releases for further directional clues. Short-term price action might test immediate support levels if hawkish sentiments from the Fed strengthen USD. However, the underlying positive economic indicators from the UK may sustain the longer-term bullish outlook. Risk management and vigilance remain essential given potential volatility.


04.15.2025
 
NZDUSD Daily Price Action Bullish Setup


Introduction to NZD/USD

The NZD/USD currency pair represents the exchange rate between the New Zealand Dollar (NZD) and the US Dollar (USD). Often referred to as the "Kiwi," this pair is heavily influenced by commodity prices, central bank decisions, and economic indicators from both countries. Traders watch NZD/USD closely as it reflects shifts in global risk sentiment, interest rate differentials, and inflation data, making it a key focus for forex investors seeking to capitalize on short-to-medium term opportunities.


NZDUSD Market Overview
The NZD/USD pair currently shows strong bullish sentiment, driven by recent economic data and investor expectations ahead of high-impact events. The upcoming New Zealand CPI q/q, forecasted at 0.8% (up from 0.5%), is fueling speculation around future RBNZ policy tightening, boosting the Kiwi. On the US side, a packed calendar includes Retail Sales (1.3%), Core Retail Sales (0.4%), and speeches from key Fed officials including Chair Powell. These events could provide critical insights into the Fed’s policy stance and short-term USD direction. Although robust US retail sales may strengthen the dollar, weaker industrial production and dovish commentary could limit upside, giving NZD/USD room to extend gains.
NZDUSD.png
NZD-USD Technical Analysis
The NZD/USD H4 chart shows a clear bullish breakout above the key resistance zone at 0.5840–0.5860 confirming the continuation of an upward trend as this move followed a brief period of consolidation near the upper edge of the Ichimoku cloud the pair is now trading above 0.5910 with the bullish market structure still intact and if momentum continues the next resistance level lies around 0.5950 followed by the significant psychological barrier at 0.6000 from a technical perspective the Ichimoku Cloud shows the price well above the cloud indicating a strong bullish trend while the future cloud is also turning positive which reinforces the possibility of continued upward movement the MACD remains in bullish territory with the MACD line above the signal line however the histogram is flattening which could point to weakening bullish momentum and the potential for short-term consolidation or a pullback the price line reflects a robust ascending wave and despite the likelihood of minor retracements the current trend structure suggests that bullish sentiment still dominates in the medium term.

Final Words about NZD vs USD
Based on both the technical and fundamental landscape, NZD/USD appears poised to sustain its bullish trajectory in the near term, especially if New Zealand’s CPI beats expectations and US industrial production disappoints. However, short-term volatility is expected due to multiple high-impact US economic reports and Fed speeches. Traders should monitor support near 0.5860 and watch for resistance reactions near 0.5950 and 0.6000. Effective risk management is crucial as price movements may accelerate with incoming news. Despite short-term corrective risks, the overall outlook for NZD/USD H4 remains bullish unless critical support levels break decisively.


04.16.2025
 
Understanding EUR/USD Daily Market Dynamics


Introduction to EUR/USD
The EUR-USD, commonly known as the "Fiber," is one of the most traded currency pairs globally, representing the Eurozone's Euro against the United States Dollar. It holds significant importance for traders due to its liquidity and volatility. Trading EUR/USD offers insights into economic relations between two of the world's largest economies, making it essential for forex investors and analysts.


EURUSD Market Overview
Currently, EUR/USD is experiencing an upward momentum, driven primarily by recent economic releases and market sentiments. The latest USD news reflects mixed economic signals; notably, the Net Long-term Securities Transactions and Jobless Claims data are influencing the currency strength positively. Additionally, speeches from Federal Reserve officials, including discussions around cybersecurity and community banking, are closely monitored for hawkish tones, potentially strengthening the USD. On the other hand, the Eurozone's economic indicators, such as the Producer Price Index and ECB monetary policy stances, suggest sustained market optimism towards the Euro. The immediate market outlook remains cautiously bullish for EUR/USD, but traders should remain vigilant of upcoming US and EU economic releases for potential volatility.
D1_Daily_EURUSD_PriceAction_Analysis_and_outlook_04_17_2025.jpg
EUR -USD Technical Analysis
Analyzing the daily chart for EUR/USD, the price recently breached a crucial Fibonacci extension level at 1.11883 and encountered resistance around the 0.618 Fibonacci level at approximately 1.13687. Currently, the price shows potential signs of initiating a corrective phase back towards the previously broken trend line, serving as immediate support. Momentum Oscillator indicates mild bullish sentiment, supporting short-term upward continuation, though suggesting caution at current resistance levels. The Linear Regression Slope Oscillator also confirms the recent bullish trend but highlights possible consolidation or retracement. Traders should closely observe the price action near these key Fibonacci and support-resistance levels for clear directional signals.


Final Words about EUR vs USD
In conclusion, the EUR USD pair appears to maintain a bullish bias in the short term but is approaching critical resistance levels, warranting cautious optimism. Given the mixed yet positive economic data from both the US and the Eurozone, traders should anticipate potential volatility around upcoming economic releases and official speeches. Proper risk management and adherence to technical indicators will be crucial for traders navigating this potentially volatile environment. Monitoring both fundamental developments and technical cues will provide better clarity on the EUR/USD's next movements.


04.17.2025
 
XRPUSD Daily Chart Hints at Further Decline


Introduction to XRP/USD
The XRP/USD currency pair tracks the price of Ripple's XRP token against the US Dollar. XRP, often referred to simply as "Ripple" in the trading community, is known for its fast transaction speeds and low fees, making it a popular choice for cross-border payments and remittances. The XRP-USD pair is one of the most closely watched digital assets in crypto trading, as movements in the U.S. dollar significantly impact XRP valuation. Understanding this pair's behavior helps traders anticipate market movements and navigate volatility.


XRPUSD Market Overview
The XRPUSD pair continues to exhibit signs of weakness amidst broader market uncertainty. Today, attention is focused on the U.S. Dollar, as Federal Reserve Bank of San Francisco President Mary Daly is scheduled to speak at the University of California, Berkeley. As a former and current FOMC voting member, any hawkish remarks or hints about future interest rate policies may support the USD, placing additional downward pressure on Ripple. In the last couple of days, Ripple’s price has been squeezed between resistance and a horizontal support level, with traders waiting for clear directional confirmation. A stronger dollar sentiment, supported by Daly's stance, may push XRP further into bearish territory.
XRPUSD_Daily_D1_Analysis_and_Price_Action_Outlook_04_18_2025.png
XRP USD Technical Analysis
The XRP USD daily chart continues to reflect a bearish sentiment that has been in place since mid-February. The Alligator indicator aligns with the downward movement — with the Jaw (blue line) sitting at the top, followed by the Teeth (red) and the Lips (green), confirming the bearish trend. The green Lips line has recently touched the last three candles, suggesting continued downward pressure. Volume bars have mostly turned red, reflecting sustained selling activity in recent sessions. Additionally, the Awesome Oscillator (AO) is fluctuating below the zero line, indicating a loss of momentum, while the Linear Regression Slope remains negative, confirming the current bearish trend. A descending triangle appears to be forming, and a breakdown below $1.95 could intensify selling pressure.


Final Words About XRP vs USD
In conclusion, XRP/USD is currently in a critical technical zone, battling against bearish momentum driven by weak price action and a strong U.S. dollar. Until there’s a clear breakout above the descending trendline and the Alligator lines realign in bullish order, upside potential remains limited. With a key USD event unfolding today, XRP traders should remain cautious and monitor both technical indicators and economic cues. A stronger dollar fueled by hawkish Fed commentary could exacerbate Ripple’s downward trajectory. On the other hand, any surprising dovish remarks might offer XRP a short-term relief rally — but only a decisive move above $2.20 would signal a possible trend reversal.


04.18.2025
 
Australian Dollar vs US Dollar: Bullish Trends Dominating Market Sentiment


Introduction to AUD/USD
The AUD/USD currency pair, often referred to as the "Aussie," represents the exchange rate between the Australian dollar and the US dollar. This major forex pair is closely watched by traders due to Australia's significant commodity exports and its correlation with global economic health. Investors and traders utilize AUDUSD analysis to make informed trading decisions and hedge against currency risk.


AUD-USD Market Overview
AUD-USD currently experiences a bullish momentum influenced by recent economic indicators and central bank statements. Over the past couple of days, traders closely monitored comments from Austan Goolsbee of the Federal Reserve, looking for insights on future US monetary policy. His remarks could influence USD strength, especially if signaling a more hawkish stance. Additionally, the upcoming IMF meeting scheduled for April 22, 2025, addressing global financial stability and monetary policy, could create substantial volatility in AUD USD. Furthermore, data from The Conference Board indicates modest growth in US economic indicators, which may provide some support to the USD. Traders should remain cautious of potential swings resulting from these high-impact events.


AUDUSD Technical Analysis
Analyzing the daily chart for AUDUSD, the pair has recently corrected the previous downtrend and regained strength over the past week. Currently, the Alligator indicator signals bullish momentum as the lips line moves above the jaw and teeth, indicating potential upward continuation. Additionally, the Linear Regression Slope turned positive, confirming a potential trend reversal or continuation upward. The Williams %R indicator remains near the overbought region, suggesting strong bullish sentiment but cautioning potential short-term corrections. Crucial resistance is currently near the Fibonacci retracement level of 0.64007, with immediate support around the 0.62736 region.


Final words about AUD vs USD
Given the technical and fundamental analysis, AUD USD is likely to maintain its bullish stance in the near term, barring unexpected hawkish developments from upcoming Federal Reserve comments or significant outcomes from the IMF meeting. Traders should closely monitor resistance and support levels, especially around Fibonacci points, and use technical indicators such as the Alligator and Williams %R to confirm trading signals. Additionally, remaining updated with US economic data and global risk sentiment can help in making informed trading decisions. Risk management strategies are highly advised given potential volatility surrounding major economic announcements.


04.21.2025
 
USDCAD Daily Forex Analysis: Technical Levels and Market Outlook


Introduction to USD/CAD
USDCAD, commonly referred to as the "Loonie," represents the exchange rate between the US dollar and the Canadian dollar. It's a widely traded currency pair heavily influenced by commodity prices, particularly crude oil, and economic events from the US and Canada. Traders and investors closely monitor USD-CAD due to its volatility and strong correlation with market sentiment and economic health in both countries.


USD/CAD Market Overview
The USD-CAD pair currently shows bearish pressure amid recent economic developments and policy cues. Investors are closely monitoring speeches from Federal Reserve officials, including Patrick Harker and Neel Kashkari, for insights into future monetary policy directions. Hawkish comments from these FOMC members typically strengthen the USD, potentially stabilizing the recent downward trend. Additionally, market participants await the IMF meeting outcome, which could impact global risk sentiment and currency valuations, including the Loonie. On the Canadian side, upcoming Industrial Product Price Index (IPPI) and Raw Materials Price Index (RMPI) data could influence the CAD by signaling future inflationary trends.


USDCAD Technical Analysis
Technically, USD CAD is currently testing a critical historical support zone near 1.3830. The Bollinger Bands have expanded significantly, indicating high market volatility, but suggest the possibility of a mean reversion. This scenario could signify that the bearish momentum is losing steam, hinting at a potential reversal or a correction upwards. The Awesome Oscillator is still negative but showing decreasing bearish momentum, supporting the potential reversal scenario. Should the price bounce back, immediate targets to the upside include the middle Bollinger Band around 1.4000 and the descending resistance trendline, acting as dynamic resistance. Traders should closely watch volume indicators for additional confirmation of trend reversal.


Final words about USD vs CAD
Given current technical signals and forthcoming economic data, USDCAD could experience a short-term bullish reversal or consolidation from its current support level. Traders are advised to keep a close eye on upcoming economic announcements and statements from central bank officials, which could sharply influence the direction of this currency pair. Risk management is paramount, as market volatility could rapidly increase due to geopolitical developments or unexpected data outcomes. A cautious approach with clear trading strategies is recommended amid current uncertain market conditions.


04.22.2025
 

Create an account or login to comment

You must be a member in order to leave a comment

Create account

Create an account on our community. It's easy!

Log in

Already have an account? Log in here.

Similar threads

Users Who Are Viewing This Thread (Total: 3, Members: 0, Guests: 3)

Top
AdBlock Detected

We get it, advertisements are annoying!

Sure, ad-blocking software does a great job at blocking ads, but it also blocks useful features of our website. For the best site experience please disable your AdBlocker.

I've Disabled AdBlock    No Thanks