What's new

Daily Market Analysis and Overview by Unitedpips

5.00 star(s) 1 Vote
NZD-USD Daily Analysis: Technical and Market Outlook


Introduction to NZD/USD

The NZDUSD pair, commonly referred to as the "Kiwi," represents the exchange rate between the New Zealand dollar (NZD) and the US dollar (USD). This forex pair is highly influenced by commodity prices, interest rate differentials, and economic data from both New Zealand and the United States. As a major currency pair, NZD/USD is popular among traders looking for volatility and opportunities in global forex markets. Its movements are closely tied to risk sentiment, making it sensitive to global economic trends and central bank policies.


NZD vs. USD Market Overview
The NZD/USD pair is experiencing mixed momentum due to recent economic events and market sentiment. On the New Zealand side, the ANZ Commodity Price Index recently reported changes in global export prices, though its impact on the NZD remains muted compared to Australian commodity trends. Additionally, RBNZ Governor Adrian Orr is set to speak at an economic conference, and traders will be watching closely for any monetary policy hints. Meanwhile, the USD remains supported by strong US economic indicators, with the ADP Non-Farm Employment Change report set to release tomorrow, offering insights into labor market strength. Furthermore, the US President is scheduled to address Congress, potentially influencing USD volatility. Other key US economic releases, including the ISM Services PMI and factory orders, could further shape NZDUSD movements this week. Given these developments, the Kiwi remains under pressure against the Greenback, with traders watching for potential breakouts or reversals.
NZDUSD_D1_Daily_Technical_analysis_and_Price_Action_on_03_05_2025.jpg
NZD/USD Technical Analysis

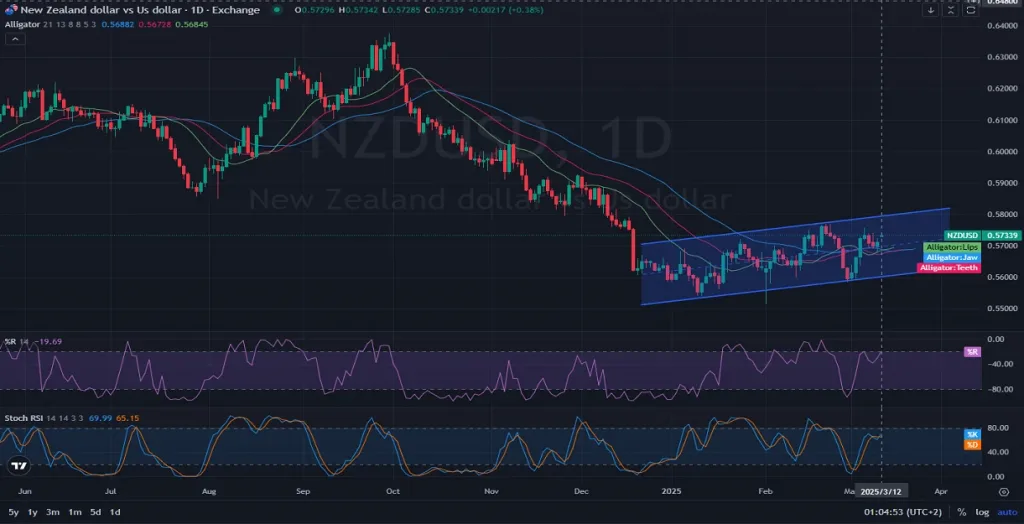
On the daily chart, NZDUSD is currently testing the middle Bollinger Band resistance level. A successful breakout above this level could see the pair climb toward the upper Bollinger Band, but a key horizontal resistance zone lies ahead, which may slow bullish momentum. The recent price action suggests a retracement following the recent downtrend, with price attempting to reclaim lost ground. From an indicator perspective, the MACD is showing signs of weakness, with the histogram indicating a potential bearish crossover. The Relative Strength Index (RSI) is hovering around 47, suggesting neither overbought nor oversold conditions, meaning the pair could move in either direction based on fundamental catalysts. Additionally, the Awesome Oscillator (AO) is in negative territory, signaling continued downside risk. A break above the resistance zone could trigger further gains, but failure to sustain momentum may lead to another test of lower support levels.


Final Words on NZD vs USD
Given the current market setup, NZD-USD remains at a critical juncture. If bullish momentum builds and the pair can break key resistance zones, an upward move toward the next resistance level is possible. However, downside risks persist, especially if upcoming US economic data strengthens the USD further. Traders should monitor key technical levels, economic events, and central bank signals to gauge the pair’s next move. Caution is advised as market volatility may increase ahead of upcoming economic releases. Proper risk management strategies, including stop-loss and take-profit levels, are crucial in navigating the current market conditions.


03.05.2025
 
Understanding USD/JPY Latest Price Action


Introduction to USDJPY

The USD/JPY currency pair, sometimes referred to by traders as “the Ninja,” tracks how many Japanese Yen one US Dollar can purchase. It is among the most actively traded forex pairs due to the robust economies behind both the US dollar and the Japanese yen. This pair often reflects global risk sentiment, as the yen is traditionally considered a safe-haven currency. Keeping an eye on USD/JPY helps traders understand market trends, interest rate differentials, and risk appetite in the global economy.


USD Vs. JPY Market Overview
Currently, USD/JPY appears to be under bearish pressure, with the global trend showing the dollar softening amid shifting market risk sentiment. In the near term, upcoming Japanese economic data releases could drive further volatility in USD/JPY. Specifically, Japan’s Labor Cash Earnings (next release on April 4) and Bank Loans data (next release on April 8) may influence yen strength if these figures exceed forecasts. The Ministry of Finance’s Current Account data (also out on April 8) can further sway the yen by indicating fluctuations in foreign demand for Japanese currency and assets. Additionally, the Cabinet Office’s Composite Index (due April 7) and Eco Watchers Current Index (due April 8) might offer insight into Japan’s economic outlook, which in turn can impact the USD/JPY daily analysis.
USDJPY_D1_Daily_Technical_analysis_and_Price_Action_on03_10_2025.jpg
USD-JPY Technical Analysis

On the Daily (D1) timeframe, USD/JPY has broken below a previously established support line, sliding into another key support region that aligns with the 0.5 Fibonacci retracement level near the 149.00–149.10 zone. Should this 0.5 Fib support hold, it could signal a potential rebound, reinforcing a broader uptrend if buyers step in. The Relative Strength Index (RSI) hovers around the lower 30s, suggesting near-oversold conditions that might attract bullish interest. Meanwhile, the Awesome Oscillator remains in negative territory, reflecting recent bearish momentum, but a shift toward the zero line could hint at a momentum change. Lastly, the MACD is also showing a bearish crossover, and with the last few Parabolic SAR dots above the price candles, sellers still hold the short-term advantage unless a clear bullish signal emerges.


Final Words about USD vs JPY
Traders watching USD/JPY should stay alert to the possibility of a bounce off the 0.5 Fibonacci level if market sentiment shifts or if Japanese data underperforms forecasts. A sustained break below current support could open the door to deeper declines, especially if the yen benefits from positive economic news. On the other hand, any uptick in US rate hike expectations or stronger US data could lend renewed support to the greenback. Overall, balancing upcoming Japanese economic announcements with US macro drivers will be key for anyone trading this pair. Keeping an eye on technical indicators, along with major support and resistance zones, can help traders spot potential entry and exit points in this dynamic market.


03.10.2025
 
AUD/USD Daily Technical and Market Analysis


Introduction to AUDUSD

The AUD/USD currency pair, often referred to as the "Aussie," represents the exchange rate between the Australian dollar and the US dollar. This pair is heavily influenced by macroeconomic factors, including interest rate decisions, commodity prices, and global risk sentiment. Traders and investors closely monitor the AUD/USD due to its correlation with economic trends in Australia, China, and the United States. As a major currency pair, its movements provide key insights into market sentiment and global financial stability.


AUD-USD Market Overview
The AUD/USD pair has been showing signs of recovery following a prolonged downtrend, as recent US economic data has influenced the greenback’s strength. The latest US Consumer Price Index (CPI) report highlights stable inflation figures, with the next major release scheduled for April 10, 2025. This data remains crucial for traders, as higher-than-expected inflation could reinforce the Federal Reserve’s hawkish stance, strengthening the US dollar and putting downward pressure on the Aussie. Additionally, oil market movements and US Treasury yields continue to impact AUD/USD. The Energy Information Administration (EIA) crude oil inventory report is due on March 19, 2025, which could affect risk sentiment, given the correlation between commodity prices and the Australian dollar. With recent Treasury auctions showing mixed results, investors remain cautious about global economic uncertainty, impacting the demand for riskier assets like AUD.
H4 - AUDUSD - Analysis and outlook - 03.12.2025 .jpg
AUD/USD Technical Analysis

On the daily timeframe, AUD vs. USD is currently hovering near a key support level, showing potential signs of reversal following a prolonged downtrend. The price action indicates a struggle at the middle Bollinger Band, a key resistance level that needs to be broken for further upside momentum. Additionally, a bullish divergence in the RSI suggests weakening bearish momentum, hinting at a possible trend shift. The MACD indicator shows a potential bullish crossover, indicating growing buying pressure. Meanwhile, the Awesome Oscillator (AO) is shifting toward positive territory, further confirming a possible bullish reversal. However, for sustained upward movement, the pair must close above 0.6300, which serves as a strong resistance level. If AUD/USD fails to hold above its current trendline support, we could see a retest of the 0.6200 psychological level.


Final Words on AUD vs USD
The AUD-USD pair remains at a critical juncture, with economic fundamentals and technical signals suggesting a potential trend shift. However, the upcoming US CPI release and energy market movements will be crucial in determining the pair’s direction. If risk sentiment improves and technical indicators align with bullish momentum, the Aussie could gain ground against the US dollar. On the downside, failure to hold above support levels may result in further bearish pressure. Traders should monitor price action closely, considering both macroeconomic events and technical signals before making decisions.


03.12.2025
 
Daily Outlook: NZD vs USD Price Action and Forecast


Introduction to NZD/USD

The NZD/USD currency pair, often referred to as the “Kiwi,” represents the exchange rate between the New Zealand dollar and the US dollar. This pair is popular among forex traders due to the relative stability of both currencies and the unique economic factors affecting each country. Monitoring the Kiwi against the US dollar is essential for understanding shifts driven by interest rates, commodity prices, and economic data releases. In this analysis, we look at the daily timeframe to capture medium-term trends and potential trading opportunities.


NZDUSD Market Overview
NZDUSD has shown signs of resilience recently, though global factors continue to influence its trajectory. In the United States, upcoming economic data includes the Producer Price Index (PPI) on April 11, 2025, and Jobless Claims on March 20, 2025, both of which can impact USD demand and overall market sentiment. The PPI figures are closely watched because higher-than-expected readings can bolster the US dollar by suggesting rising inflationary pressures. Meanwhile, in New Zealand, tourism statistics play a significant role, and the next update on overseas visitor arrivals is scheduled for April 14, 2025. Any surprising uptick in these figures could support the Kiwi, as a stronger tourism sector often correlates with economic growth and currency strength. Overall, traders should keep an eye on both countries’ economic calendars for sudden shifts in NZD-USD momentum.

NZD-USD Technical Analysis
On the daily chart, NZD USD has been trading within a gentle upward channel, hinting at a moderate bullish trend over recent weeks. However, a correction seems to be unfolding, as the Alligator indicator’s green lips have crossed below the blue jaw and red teeth, signaling potential consolidation or a shift in momentum. The lines of the Alligator are now converging, which often suggests that a decisive breakout could be on the horizon. Meanwhile, the Stochastic RSI (%K and %D) and Williams %R are hovering around mid-levels, reflecting a possible slowdown in buying pressure and an increased chance of sideways movement. Traders should watch for a break of key support and resistance levels within this channel to confirm whether NZD-USD will continue its broader uptrend or enter a deeper retracement phase.


Final Words About NZD vs USD
Given the ongoing correction, NZD USD traders may want to stay alert for signs of renewed bullish momentum or a deeper pullback. Fundamental releases, especially US PPI data and New Zealand’s tourism figures, can quickly alter market sentiment. Keeping track of labor market updates in the US, such as weekly Jobless Claims, is also essential, as these reports can shift the US dollar’s strength relative to the Kiwi. From a technical standpoint, maintaining a close eye on the Alligator indicator’s alignment and oscillators like the Stoch RSI is vital for spotting early trend reversals. Overall, while the Kiwi has room to maintain its medium-term gains, it remains vulnerable to shifts in risk sentiment and economic data surprises.


03.13.2025
 
US Dollar Softens: Impact on GBP/USD Price Action


Introduction to GBPUSD

The GBPUSD currency pair, often referred to by the nickname “Cable,” represents the exchange rate between the British Pound Sterling and the US Dollar. The name “Cable” comes from the historical undersea telegraph cable that once linked the UK and the US, facilitating currency quotes across the Atlantic. GBP-USD is one of the oldest and most traded currency pairs, making it vital for global financial markets. Understanding its fluctuations provides traders with key insights into the economic health of both the United Kingdom and the United States.


GBP USD Market Overview
GBP USD has been showing an overall bullish correction after a significant prior downtrend, and recent economic data releases continue to shape its direction. From the UK side, upcoming reports on monthly GDP, Construction Output, Services, Industrial Production, and Manufacturing Production—scheduled for April 11, 2025—could play a pivotal role in determining the pair’s next move. Market participants are also watching the Bank of England’s quarterly inflation expectations, due on June 13, 2025, to gauge the Pound’s potential strength. Meanwhile, from the US perspective, the University of Michigan Consumer Sentiment and Inflation Expectations—next released on April 11, 2025—may bolster or weaken the US Dollar depending on how the actual figures compare with forecasts. These indicators collectively influence GBP/USD by affecting investor sentiment, risk appetite, and monetary policy expectations in both economies.
D1-Daily-GBPUSD - PriceAction-Analysis and outlook - 03.14.2025.png
GBP/USD Technical Analysis

On the daily (D1) chart, GBP/USD appears to be trading within a bullish regression channel, correcting its previous bearish momentum. The Alligator indicator signals strength in the uptrend: the green lips line sits above the red teeth, which in turn remains above the blue jaw. Price action is also holding above these Alligator lines, reinforcing the bullish sentiment. Notably, GBP/USD is hovering around the 0.382 Fibonacci retracement level drawn from the last major swing high to low, and the previous bearish candle found support near this Fib line before closing. Meanwhile, the %R oscillator is nearing overbought territory, suggesting that while upside momentum is strong, traders should watch for possible short-term pullbacks or consolidation.


Final words about GBP vs USD
Overall, Cable’s momentum remains biased to the upside, supported by strong recovery signals and positive UK data expectations. However, key US releases—particularly sentiment and inflation forecasts—may shift sentiment in favor of the US Dollar if they beat consensus estimates. Traders should be mindful of any retracements toward the Alligator support lines or lower Fibonacci levels to confirm if the bullish trend remains intact. Monitoring upcoming economic releases from both the UK and the US will be crucial for gauging trend continuation or reversal. Maintaining a balanced view on risk management is essential, as volatility could rise ahead of the April 11, 2025 data releases.


03.14.2025
 
USD/CAD Daily Analysis (D1)


Introduction to USDCAD

The USD/CAD, popularly known as "The Loonie," is one of the most actively traded forex pairs globally, reflecting the economic relationship between the United States and Canada. This pair is strongly affected by fluctuations in commodity prices, particularly oil, due to Canada's role as a significant commodity exporter. Traders closely monitor economic indicators from both nations, including manufacturing, housing, inflation, and employment data, as these can substantially influence price movements.


USD/CAD Market Overview
The USD-CAD is currently experiencing bearish sentiment, driven by recent economic developments. Traders are awaiting key U.S. data on residential building permits, industrial production, and import prices scheduled for release in mid-April. Positive outcomes in these indicators would strengthen the USD, potentially pushing the USD/CAD higher. Meanwhile, upcoming Canadian inflation data, notably the Consumer Price Index (CPI) and CPI excluding volatile items, will play a critical role. Strong Canadian inflation data could strengthen the CAD and weigh on the pair.
D1_Daily_USDCAD_PriceAction_Analysis_and_outlook_03_18_2025_.jpg

USD/CAD Technical Analysis
On the daily timeframe (D1), USD CAD has broken below its ascending trendline, signaling a short-term bearish outlook. Price action has moved toward the lower Bollinger Band, indicating bearish momentum that could target the critical horizontal support around 1.38419. The MACD is showing a bearish crossover, suggesting further downside potential. The RSI has moved below the neutral 50 level, reinforcing bearish sentiment. The Awesome Oscillator indicates weakening bullish momentum and increasing bearish pressure, while the ATR signals rising volatility, pointing to potential significant price movements ahead.


Final words about USD vs CAD
USDCAD appears poised for continued short-term bearish movement based on current technical indicators and market sentiment. Traders should keep a close watch on upcoming economic releases from both the U.S. and Canada, as these will likely be decisive for the pair's next significant move. Maintaining cautious positions and setting clear stop-loss orders will be important due to increased volatility expectations. The support at 1.38419 should be closely monitored for potential price reversals or breakthroughs, influencing trading strategies accordingly.


03.18.2025
 
Understanding EUR/USD Daily Price Action


Introduction to EURUSD
The EUR USD pair, commonly referred to as the "Fiber," represents the exchange rate between the Euro and the US Dollar. As one of the most actively traded currency pairs globally, it reflects economic conditions in the Eurozone and the United States. Traders rely on EUR/USD for its liquidity, volatility, and sensitivity to major economic news and policy announcements. Understanding movements in EUR-USD can significantly inform trading and investment strategies.


EURUSD Market Overview
Currently, EUR/USD is exhibiting bullish momentum, driven by positive market sentiment towards the Eurozone's economic stability and recent inflation data. Recent reports from Eurostat indicated stability in consumer price levels, with the Core Consumer Price Index (CPI) closely watched by traders. Upcoming data, including Germany’s 30-year bond auction results (Bund Auction), may introduce volatility based on investor sentiment indicated by yield and demand figures. Meanwhile, the US dollar has seen cautious optimism due to stable crude oil inventories reported by the EIA, and future monetary policy outlooks provided by recent FOMC statements and forecasts. The upcoming Federal Reserve meeting is being closely monitored by traders for signs of future interest rate adjustments, which could significantly influence EUR/USD dynamics in the short term.
D1_Daily_EURUSD_PriceAction_Analysis_and_outlook_03_19_2025.jpg

EUR-USD Technical Analysis

Analyzing the daily (D1) chart, EUR USD is testing a critical resistance zone around 1.0930-1.0950 for the second time after initially failing to break through. The wide Bollinger Bands suggest heightened volatility, implying potential corrective movement towards the midline at around 1.0630 or lower if the pair fails to secure the breakout. The MACD histogram is showing weakening bullish momentum, suggesting possible consolidation or reversal. The RSI currently indicates overbought conditions, highlighting caution for potential selling pressure ahead. Additionally, the ATR indicator signals increased volatility, while the Awesome Oscillator (AO) also confirms diminishing upward momentum, suggesting caution is advisable for bullish traders.


Final words about EUR vs USD
In conclusion, the EURUSD pair is at a pivotal junction, testing crucial resistance that could either result in a bullish breakout or lead to a downward correction. Traders should closely monitor upcoming Eurozone inflation figures and German bond auction results, as well as the Fed’s statements and US economic indicators for clearer directional cues. Technical indicators currently suggest caution, as the risk of reversal or short-term pullbacks remains high. Traders should exercise prudent risk management and stay alert to economic updates that may influence short-term price movements. EUR/USD remains attractive for both short-term volatility trading and long-term strategic positioning.


03.19.2025
 
EUR/GBP Daily Price Action Analysis and Outlook


Introduction to EUR/GBP

The EUR GBP pair, commonly referred to as "Chunnel," represents the relationship between the Euro and the British Pound. As one of Europe's most closely watched currency pairs, EUR/GBP is influenced by economic indicators from both the Eurozone and the United Kingdom. Understanding the movements in this pair helps traders gauge economic health, monetary policy divergence, and market sentiment within these major economic zones.


EURGBP Market Overview
EUR-GBP currently exhibits a mixed yet slightly bullish sentiment driven by recent economic data releases. Both Eurozone and UK Purchasing Managers' Index (PMI) reports from S&P Global indicated economic resilience, with values above the critical 50.0 threshold, suggesting industry expansion. Traders are closely monitoring these indicators, as positive PMI numbers generally strengthen currency positions. Additionally, the market awaits comments from Bank of England Governor Andrew Bailey, whose economic outlook speech at the University of Leicester could significantly influence GBP volatility. Given the positive PMI environment for both currencies, market participants expect moderate volatility in EUR/GBP, maintaining a cautious yet optimistic outlook.
D1_Daily_EURGBP_PriceAction_Analysis_and_outlook_03_24_2025_.jpg
EUR/GBP Technical Analysis

Analyzing the EUR-GBP daily chart, price action has recently broken above a long-standing downward trend line and subsequently retested it, forming a new bullish trend line. After encountering resistance at an ascending trend line, the pair retraced into a key support zone around 0.83770, suggesting a potential completion of its correction phase. The RSI indicator currently reads at approximately 54, indicating neutral momentum with a slight bullish bias. Parabolic SAR dots remain above the price, signaling short-term bearish sentiment; however, the MACD histogram is contracting toward the zero line, signaling fading bearish momentum. The Awesome Oscillator similarly suggests a possible bullish reversal if it crosses into positive territory. The current technical setup suggests potential upside targeting the resistance level at 0.84570.


Final Words about EUR vs GBP
EUR/GBP is poised for potential upward movement supported by positive economic data and favorable technical indicators. Traders should watch closely for confirmation signs from momentum oscillators and price action at critical support and resistance levels. Caution is advised ahead of Governor Bailey's speech, which could introduce significant short-term volatility. Maintaining effective risk management strategies remains essential due to potential uncertainty around macroeconomic developments. Overall, the current environment points toward a cautiously optimistic scenario for EUR/GBP bulls.


03.24.2025
 

Create an account or login to comment

You must be a member in order to leave a comment

Create account

Create an account on our community. It's easy!

Log in

Already have an account? Log in here.

Members Online

No members online now.

Similar threads

Users Who Are Viewing This Thread (Total: 1, Members: 0, Guests: 1)

Top