What's new

Forex News Daily Analysis By FXGlory

4.70 star(s) 3 Votes
GBPAUD H4 Technical and Fundamental Analysis for 09.19.2024


Time Zone: GMT +3
Time Frame: 4 Hours (H4)


Fundamental Analysis:

The GBPAUD pair represents the British Pound (GBP) against the Australian Dollar (AUD), both of which are influenced by central bank policies and global economic conditions. Today, the GBP faces significant news with the release of the Bank of England's Monetary Policy Summary and voting breakdown, which could provide insight into the central bank's stance on interest rates. Hawkish sentiments from the Bank of England could strengthen the GBP, leading to potential bullish momentum. On the AUD side, employment data and the unemployment rate are key market-moving events for today. Better-than-expected Australian employment figures could bolster the AUD, adding downward pressure on the pair. Both currencies are subject to central bank guidance and economic data, making today critical for GBP AUD price movements.


Price Action:
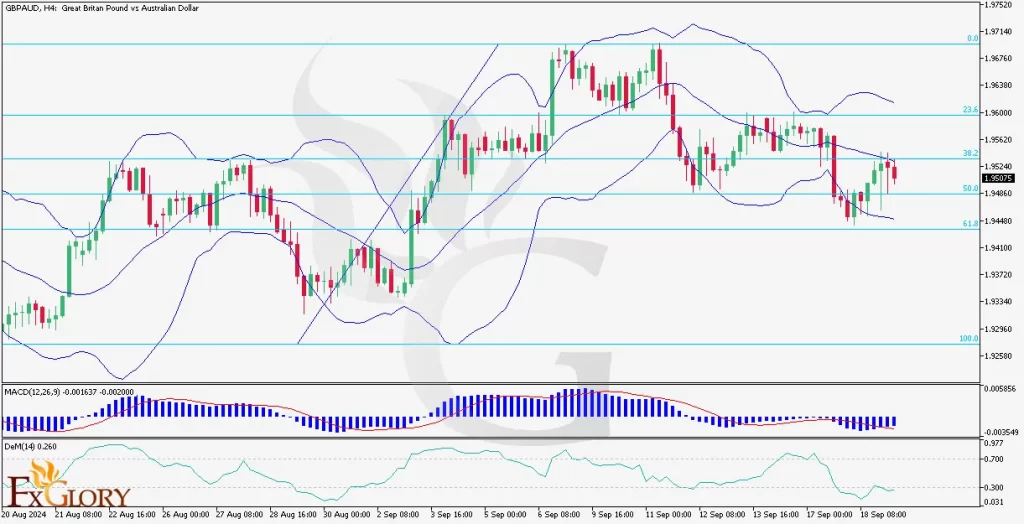
On the H4 timeframe, the GBP/AUD pair is currently showing bearish tendencies, as seen from the last two candles that have declined. The price is trading between the 38.2% and 50.0% Fibonacci retracement levels, indicating potential support near the 50.0% level. The GBPAUD Price action shows movement toward the lower half of the Bollinger Bands after briefly touching the middle band. This suggests a potential downward continuation. If the price breaks below the 50.0% Fibonacci level, we could see further bearish momentum.


Key Technical Indicators:
Bollinger Bands:
The price has been moving from the lower band toward the middle band but is currently heading back toward the lower band. This indicates a bearish move, with volatility expected to increase as the price approaches the lower Bollinger Band. If the price remains in the lower half of the bands, it may continue on a downward path.
MACD (Moving Average Convergence Divergence): The MACD histogram is showing decreasing momentum, with the MACD line slightly below the signal line. This suggests bearish momentum is building, and traders should watch for a potential continuation of the downward trend if the MACD crosses further below the signal line.
DeMarker (DeM) (14): The DeMarker indicator currently sits at 0.260, which is below the neutral zone, indicating that the pair is nearing oversold conditions. While this suggests that the selling pressure could slow down, it also signals that there may be room for further bearish movement before a possible reversal.


Support and Resistance Levels:
Support:
Immediate support is found at the 50.0% Fibonacci retracement level at approximately 1.9502. Further support can be seen near the 61.8% Fibonacci level at 1.9440.
Resistance: Immediate resistance is near the 38.2% Fibonacci level at 1.9562. Stronger resistance lies at 1.9600, aligning with the upper Bollinger Band.


Conclusion and Consideration:
In conclusion, the GBP AUD pair on the H4 chart shows signs of bearish momentum with the price moving toward the lower half of the Bollinger Bands and declining MACD momentum. The DeM indicator nearing oversold territory signals potential for a short-term reversal, but the overall bearish outlook remains dominant. Traders should watch key support and resistance levels, particularly around the 50.0% and 38.2% Fibonacci levels, for signs of a breakout or reversal. With important economic data releases from both the UK and Australia, heightened volatility is expected, making it crucial for traders to monitor these indicators closely.


Disclaimer: The GBPAUD H4 provided analysis is for informational purposes only and does not constitute financial advice. Traders should perform their own analysis and consider market conditions before making any trading decisions. Markets can change rapidly, and staying updated with the latest news is essential for successful trading.


FXGlory
09.19.2024


USDCAD H4 Technical and Fundamental Analysis for 09.20.2024


Time Zone: GMT +3
Time Frame: 4 Hours (H4)


Fundamental Analysis:
The USD/CAD forex pair is influenced today by key fundamental events from both the U.S. and Canada. In the U.S., the market anticipates remarks from Federal Reserve Bank of Philadelphia President Patrick Harker at Tulane University. Traders will be watching for any hawkish signals regarding future monetary policy, which could strengthen the USD. On the Canadian side, Bank of Canada Governor Tiff Macklem is scheduled to speak at the National Bureau of Economic Research conference in Toronto. His commentary could provide insights into future interest rate policies, impacting the CAD. Additionally, the release of retail sales data and industrial product prices from Canada could drive market volatility depending on how the actual figures align with market forecasts.


Price Action:
In the H4 timeframe, USDCAD has been trading in a range between 1.3500 and 1.3650 over the past few sessions, indicating consolidation after a bullish recovery. The price attempted to break out above 1.3650 but failed, pulling back toward the 23.6% Fibonacci retracement level. The recent candles suggest indecision as the price hovers near the 1.3565 level. This area has acted as a key pivot zone over the past few sessions, reflecting the current battle between bulls and bears.


Key Technical Indicators:
Bollinger Bands:
The Bollinger Bands on the USD/CAD H4 chart have widened, signaling increased volatility. The price has moved toward the lower band after touching the upper band near 1.3650, indicating a potential downward pressure. However, the price remains within the bands, suggesting the market is not yet oversold. Traders should watch for a breakout of the bands to signal the next directional move.
MACD (Moving Average Convergence Divergence): The MACD indicator shows a weakening bullish momentum, with the MACD line crossing below the signal line and the histogram in negative territory. This bearish crossover signals a possible continuation of the downside momentum unless the MACD can reverse and move back above the signal line. However, the low distance between the lines suggests the trend could reverse if fundamentals support USD strength.
DeMarker (DeM 14): The DeMarker (DeM) indicator sits at 0.429, indicating potential oversold conditions. This suggests that there might be some buying interest soon if the indicator starts to rise. However, for now, the DeM signals that the downside pressure could continue in the near term unless a reversal occurs.


Support and Resistance:
Support:
Immediate support for USDCAD is at 1.3565, aligned with the 23.6% Fibonacci retracement level and the recent price pivot. If the pair breaks below this, the next key support is at 1.3500, a psychological level that has historically acted as a strong barrier.
Resistance: Immediate resistance is found at 1.3640, which coincides with the 38.2% Fibonacci retracement level and marks the upper boundary of recent price action. A breakout above this level could push the pair toward 1.3695, the 50% retracement level, where further resistance may be encountered.


Conclusion and Consideration:
The USD-CAD pair is currently in a consolidation phase after failing to break above the 1.3640 resistance level. With technical indicators pointing toward slight bearish momentum and upcoming key fundamental events, the pair could face heightened volatility. Traders should closely monitor the speeches from the Federal Reserve and Bank of Canada governors, as these could provide clues on future interest rate decisions and drive price action. A break above 1.3640 would confirm a bullish breakout, while a move below 1.3560 could see the pair targeting 1.3500.


Disclaimer: The USD CAD analysis provided is for informational purposes only and does not constitute investment advice. Trading in the foreign exchange market involves significant risk, and it is essential for traders to conduct their research and stay updated with market conditions before making any trading decisions.


FXGlory
09.20.2024
 
GBPUSD H4 Technical and Fundamental Analysis for 09.23.2024


Time Zone: GMT +3
Time Frame: 4 Hours (H4)


Fundamental Analysis:

The GBP/USD news analysis today shows that it continues to experience volatility amid global economic uncertainties. Recent PMI data releases from the UK show manufacturing sector contraction, as indicated by S&P Global’s latest surveys, with figures below 50, signaling economic slowdown. This data puts pressure on the British Pound, particularly as concerns about the UK's economic resilience persist. Meanwhile, for the USD, market participants are keenly focused on the speeches from Federal Reserve officials, including Raphael Bostic and Austan Goolsbee, who are expected to provide insights into future monetary policy and interest rate adjustments. With key economic indicators such as inflation and PMI set to influence the pair’s forecast today, traders are advised to monitor the upcoming GBP/USD fundamental releases closely for any signs of economic recovery or further contraction in both the UK and the US.


Price Action:
The GBP USD H4 chart reveals a clear upward channel for the pair also known as the “Cable,” with its price action making higher highs and higher lows. The pair is currently approaching key resistance levels near 1.3290 and 1.3326, following a steady uptrend since early September. The pair’s candlesticks reflect strong buying interest, as its bullish market sentiment drives the price upward. However, it is crucial to watch for potential reversals if the price fails to break through the established resistance.


Key Technical Indicators:
Ichimoku Cloud:
The price is trading above the Ichimoku cloud, indicating a strong bullish trend. The cloud is thin, suggesting limited resistance ahead, but traders should remain cautious if the price dips towards the cloud for potential reversals.
RSI (Relative Strength Index): The RSI is hovering around 67.67, indicating that the pair is nearing overbought territory. This suggests the possibility of a pullback or consolidation before any further upward moves.
Stochastic Oscillator: The Stochastic is also in the overbought region at 75.25, reinforcing the likelihood of a short-term correction as the market approaches resistance levels.


Support and Resistance:
Support Levels:
Immediate support can be found at 1.3261, which aligns with the lower boundary of the upward channel. A break below this level could lead to further downside, with the next support around 1.3180.
Resistance Levels: The pair faces key resistance at 1.3290, followed by a stronger resistance level at 1.3326. A breakout above these levels could propel the pair towards higher highs in the coming sessions.


Conclusion and Consideration:
he GBP/USD technical outlook today is exhibiting strong bullish momentum on the pair’s H4 chart, supported by favorable technical indicators. However, the RSI and Stochastic suggest the pair is nearing overbought conditions, which could result in a brief correction or consolidation around key resistance levels. The GBPUSD fundamental factors, such as the upcoming PMI data for both the UK and US, along with Federal Reserve speeches, will play a critical role in determining the pair's next direction. Traders are advised to exercise caution, especially with the Cable’s volatility surrounding key economic releases. Implementing solid risk management strategies, such as setting stop-loss orders near support levels, will help mitigate risk in this volatile trading environment.


Disclaimer: The provided analysis is for informational purposes only and does not constitute investment advice. Traders should conduct their own research and analysis before making any trading decisions.


FXGlory
09.23.2024
 
AUDUSD H4 Technical and Fundamental Analysis for 09.24.2024


Time Zone: GMT +3
Time Frame: 4 Hours (H4)


Fundamental Analysis:

The AUD/USD pair is currently influenced by critical economic events. Earlier today, the Reserve Bank of Australia (RBA) maintained its cash rate at 4.35%, which was anticipated by the market, accompanied by the RBA Rate Statement and subsequent Press Conference. These factors are crucial in shaping the Australian dollar's direction against United States’ Dollar. The RBA’s stance was seen as relatively neutral, keeping future rate hikes uncertain. Meanwhile, on the USD side, significant events like the upcoming FOMC member Bowman’s speech and data releases, such as the S&P/CS Composite-20 HPI y/y (5.9%, below the expected 6.5%) and the CB Consumer Confidence report, are likely to weigh on the US dollar’s performance. With the U.S. data releases showing mixed results, traders are closely monitoring the market for any clues on future Fed policy moves.


Price Action:
The AUD/USD H4 chart today shows a correction following a bullish rally. The price has now moved lower, testing a key support zone, indicating a consolidation phase. The Bollinger Bands show a sharp decline in volatility, with the price touching the lower band, suggesting the potential for a short-term bounce. However, the pair remains under pressure as both fundamental and technical factors point to a cautious sentiment. If AUD/USD breaks below current support, further downside may be expected, while holding above could see the pair attempt a recovery.


Key Technical Indicators:
Bollinger Bands:
The price is currently hugging the lower Bollinger Band, indicating a possible oversold condition in the short term. A contraction in the bands suggests lower volatility, signaling that a breakout might be imminent.
MACD (Moving Average Convergence Divergence): The MACD is in bearish territory, with the MACD line below the signal line. The histogram is also below zero, supporting the bearish outlook. This indicates a potential for further downside if momentum doesn't shift soon.
DeM (DeMarker Indicator): The DeMarker indicator is currently reading at 0.334, signaling that the pair may be in an oversold condition, which could indicate a short-term bullish reversal if buyers step in at current levels.


Support and Resistance:
Support Levels:
The immediate support is at 1.35000, aligning with a key psychological level. A stronger support level is noted at 1.34610, which coincides with a previous low from earlier sessions.
Resistance Levels: The nearest resistance is at 1.35700, which aligns with the middle of the Bollinger Bands and prior consolidation. The next significant resistance is around 1.36050, which marks the upper boundary of the recent price action.


Conclusion and Consideration:
The AUD/USD technical analysis suggests a cautious outlook as the pair consolidates within the lower Bollinger Band range, signaling potential short-term downside pressure. However, oversold conditions on both the DeM and Bollinger Bands suggest a possible rebound if key support holds. Traders should monitor the MACD for confirmation of continued bearish momentum or potential reversal on AUDUSD price chart. Additionally, economic events like the RBA Press Conference and upcoming U.S. data releases could add volatility to the pair. In this uncertain market environment, prudent risk management is advised, with close attention paid to the 1.35000 support and 1.35700 resistance levels for any breakout signals.


Disclaimer: The provided analysis is for informational purposes only and does not constitute investment advice. Traders should conduct their own research and analysis before making any trading decisions.


FXGlory
09.24.2024
 
EURUSD H4 Technical and Fundamental Analysis for 09.26.2024


Time Zone: GMT +3
Time Frame: 4 Hours (H4)


Fundamental Analysis:

The EUR/USD fundamental outlook today is influenced by both the Eurozone's economic factors and the strength of the US dollar. Recently, several key developments in both economies have affected this pair that’s also known as the “Fiber”. The US dollar has seen strength due to hawkish comments from Federal Reserve officials like Governor Adriana Kugler, signaling potential rate hikes. Additionally, economic data from the US, including durable goods orders and jobless claims, have contributed to dollar strength. On the Euro side, consumer sentiment measured by the GfK survey, and remarks from ECB President Christine Lagarde have highlighted inflationary pressures, which could push the European Central Bank towards a hawkish stance. With both central banks hinting at potential tightening, the EUR/USD forex pair remains at the mercy of its fundamental economic releases and policy updates in the coming days.


Price Action:
The EUR/USD price action on the pair’s H4 chart reveals a notable bullish trend, with price action testing resistance levels around 1.1184 to 1.1187. After a breakout attempt, the price faced rejection at the top of the rising channel. The pair seems to be consolidating around key support zones, reflecting market indecision as traders await further developments from central banks. The recent price decline suggests that bears have temporarily regained control, but with the price hovering near the lower boundary of the rising channel, further upward movement is possible if key support holds.


Key Technical Indicators:
Ichimoku Cloud:
The price is trading within the cloud, signaling a potential period of consolidation. The lagging span also suggests mixed momentum, with no clear direction yet, as traders await additional catalysts.
RSI (Relative Strength Index): The RSI is at 45.64, indicating neutral momentum. It's neither in the oversold nor overbought territory, suggesting that the market may be gearing up for its next significant move depending on economic news or technical breakout opportunities.
MACD: The MACD histogram remains slightly positive, with a minor bullish bias as the MACD line hovers near the signal line. However, momentum appears weak, and a more significant move would be required to confirm directionality.


Support and Resistance:
Support Levels:
The immediate support level is 1.1129, which is aligned with the rising trendline. A breach below this level could push the pair towards the 1.1116 zone, which marks the lower boundary of the channel.
Resistance Levels: The pair faces strong resistance at 1.1184 and 1.1187, the latter being a key psychological level. A break above this resistance could set the stage for a bullish continuation towards 1.1230.


Conclusion and Consideration:
The EURUSD technical analysis on its H4 chart is showing signs of consolidation as it trades near key support levels. With both the Ichimoku cloud and MACD offering mixed signals, traders should wait for a breakout either above resistance at 1.1187 or a breakdown below 1.1129 to determine the next significant directional move. Upcoming speeches by Federal Reserve and ECB officials, as well as economic data, will be crucial for traders looking to capitalize on the Fiber’s volatility. Setting appropriate risk management tools, such as stop-losses near key support/resistance zones, will be essential to navigate the EUR-USD market fluctuations.


Disclaimer: The provided analysis is for informational purposes only and does not constitute investment advice. Traders should conduct their own research and analysis before making any trading decisions.


FXGlory
09.26.2024
 
USDCAD H4 Daily Technical and Fundamental Analysis for 09.27.2024


Time Zone: GMT +3
Time Frame: 4 Hours (H4)


Fundamental Analysis:

The USDCAD pair reflects the exchange rate between the US Dollar (USD) and the Canadian Dollar (CAD). Today’s key events impacting this pair include the upcoming speech from Federal Reserve Governor Lisa Cook, which could hint at future monetary policy, especially regarding interest rates and the impact of artificial intelligence on the labor force. In addition, traders are waiting for important US inflation data and the Bureau of Economic Analysis’ upcoming reports on trade and income. On the Canadian side, attention will be on GDP figures, which offer insights into the country's economic performance. These events could drive significant volatility for USDCAD in the coming sessions.


Price Action:
On the H4 chart, USDCAD is showing signs of a potential reversal after a strong bearish move. The price is currently in an upward channel following a drop, indicating a recovery phase. The pair recently found support around 1.3430 and has started to retrace upwards, moving closer to the 1.3470 resistance level. There are multiple signs suggesting a possible breakout if the bullish momentum continues, but traders should be cautious as the pair remains below the Ichimoku cloud, signaling potential further consolidation before a stronger move.


Key Technical Indicators:
Ichimoku Cloud:
The price is trading below the Ichimoku cloud, signaling a bearish long-term sentiment. However, the upward trend from recent lows indicates potential bullish recovery, though it remains weak until the price breaks above the cloud.
MACD (Moving Average Convergence Divergence): The MACD line is slightly below the signal line, and the histogram shows weak bearish momentum. Although there is some upward movement, a clearer bullish signal would emerge only if the MACD line crosses above the signal line, indicating stronger buying pressure.
DeMarker (DeM 14): The DeMarker indicator stands at 0.587, suggesting that the market is approaching an overbought condition. While not fully signaling exhaustion, traders should watch for any overbought conditions that might lead to a temporary pullback.
Williams %R (14): The Williams %R is at -14.71, nearing overbought territory. This suggests that the current upward momentum may face resistance soon, and a retracement could be imminent if the pair fails to break above key resistance levels.


Support and Resistance Levels:
Support:
The nearest support is at 1.3430, a level where the price recently found a bounce.
Resistance: The immediate resistance is at 1.3480, aligned with the 23.6% Fibonacci level. The next key resistance is at 1.3525, corresponding to the 38.2% Fibonacci level.


Conclusion and Consideration:
The USDCAD H4 chart is showing signs of a possible bullish recovery following a recent drop. However, the pair remains below the Ichimoku cloud, suggesting the longer-term trend is still bearish until confirmed otherwise. The MACD and Williams %R indicators show cautious optimism, but traders should be wary of overbought conditions, especially as the price nears key Fibonacci resistance levels. With upcoming fundamental news from both the US and Canada, volatility is expected. As always, traders should stay informed of breaking news and economic data to avoid unexpected market movements.


Disclaimer: The analysis provided here is for educational purposes and should not be considered as financial advice. Market conditions may change rapidly, and traders should conduct their own research before making any trading decisions.


FXGlory
09.27.2024
 
EURGBP H4 Technical and Fundamental Analysis for 09.30.2024


Time Zone: GMT +3
Time Frame: 4 Hours (H4)


Fundamental Analysis:

The EUR/GBP news analysis today is influenced by various fundamental factors, including economic indicators, interest rates, and geopolitical events impacting both the Eurozone and the UK. As the European Central Bank (ECB) and the Bank of England (BoE) manage their monetary policies, traders closely monitor releases such as the Consumer Price Index (CPI) and Gross Domestic Product (GDP) data from both regions. Recent releases indicate inflationary pressures in the Eurozone, which could prompt the ECB to adopt a more hawkish stance. Conversely, economic growth and inflation data from the UK may provide insights into the BoE's potential interest rate decisions, further impacting the EURGBP forecast today. Overall, these dynamics complicate the pair’s market environment, where traders need to stay alert to macroeconomic changes and their implications for the currency’s valuation.


Price Action:
The EUR/GBP H4 chart shows the price is currently trending below the Ichimoku Cloud, indicating the pair’s bearish sentiment. Its price action has shown a consolidation phase following a previous downtrend, suggesting a possible accumulation of positions before a potential breakout. The market is currently oscillating near key support and resistance levels, with the pair’s price movement reflecting indecision among traders.


Key Technical Indicators:
Ichimoku Cloud:
The price trading below the Ichimoku Cloud highlights the pair’s bearish market structure. A breakout above the cloud would be necessary for a trend reversal, while a sustained movement below it suggests ongoing selling pressure.
RSI (Relative Strength Index): The RSI is positioned at 48.43, indicating that the EURGBP sentiment is neutral with no clear overbought or oversold conditions. This level suggests that there is potential for either a bullish reversal or a continuation of the bearish trend, depending on future price action.
Stochastic Oscillator: The Stochastic Oscillator shows values of 72.15 and 66.96, indicating a potential overbought condition. This could suggest that the price may face resistance at current levels, leading to a correction or pullback if sellers begin to dominate the market.


Support and Resistance:
Support Levels:
The nearest support is at 0.83311, with further support located at 0.83205. These levels are critical as they may attract buying interest if the price tests them.
Resistance Levels: The nearest resistance level is at 0.83460. A breakout above this level could signify a shift in momentum, potentially paving the way for higher prices.


Conclusion and Consideration:
The EUR/GBP forecast today on its H4 chart is currently exhibiting signs of consolidation after a bearish phase, supported by the positioning of key technical indicators. With the price below the Ichimoku Cloud, traders should be cautious about potential short positions, particularly near key resistance levels. However, the RSI and Stochastic Oscillator suggest a watchful approach, as they indicate neutral to slightly overbought conditions. Upcoming economic releases and ECB/BoE communications will be crucial in determining the pair’s future price movements. Risk management strategies, including stop losses, should be implemented to navigate the volatility inherent in this currency pair.


Disclaimer: The provided analysis is for informational purposes only and does not constitute investment advice. Traders should conduct their own research and analysis before making any trading decisions.


FXGlory
09.30.2024
 
EURJPY analysis for 31.10.2023


View attachment 27042


The EURJPY 4H chart shows signs of market consolidation within the Bollinger Bands. The currency pair has been oscillating between the upper and lower bands, indicating periods of volatility followed by stabilization. Notably, the Parabolic SAR dots, initially above the price candles suggesting a bearish trend, have recently moved below them, hinting at a possible bullish reversal. However, the proximity of the price candles to the middle Bollinger Band indicates a lack of strong directional bias. Traders should exercise caution and wait for a clear breakout from the bands or a consistent trend in the Parabolic SAR before making decisive moves. The upcoming sessions will be crucial to determine the pair's next direction.


FXGlory
31.10.2023
what is the rate of return on this strategy
 
EURCAD H4 Technical and Fundamental Analysis for 10.01.2024


Time Zone: GMT +3
Time Frame: 4 Hours (H4)


Fundamental Analysis:

The EUR/CAD pair is currently influenced by various economic developments. The Canadian Dollar's movement is heavily tied to oil prices, and recent volatility in the oil market has caused fluctuations in the CAD. The Bank of Canada’s (BoC) decision to hold interest rates has also kept the CAD under pressure. Meanwhile, Eurozone data continues to show mixed results, with weaker industrial production in Germany. However, inflationary pressures persist in the Eurozone, adding complexity to the European Central Bank's (ECB) future policy moves. Both these factors are shaping the EUR/CAD's performance this week, with upcoming economic data releases and oil price movements playing a critical role.


Price Action:
The EUR/CAD H4 chart indicates that the pair is trading in a consolidation phase after a recent bullish push. The price action shows a pullback from the 1.5170 resistance level and is currently hovering around the 1.5060 level. The pair is testing the lower boundary of a consolidation range, with key support at 1.4900. Bollinger Bands show decreased volatility, suggesting the potential for a breakout in the near term. Traders should watch for a decisive break either above the resistance at 1.5170 or below the 1.4900 support to determine the next move.


Key Technical Indicators:
William %R:
The Williams %R on the EUR/CAD chart is near -56, indicating a neutral state with no strong overbought or oversold signals. A further drop below -80 could indicate oversold conditions, signaling potential buying opportunities.
MACD (Moving Average Convergence Divergence): The MACD is in bearish territory, with the MACD line below the signal line. The histogram is also below zero, supporting the bearish outlook. This indicates a potential for further downside if momentum doesn't shift soon.
DeM (DeMarker Indicator): The DeMarker indicator is near 0.45, indicating that the pair is not in an oversold condition but may face continued selling pressure if it breaches key support levels.


Support and Resistance:
Support Levels:
The immediate support is found at 1.4900, a psychological level that has acted as a strong base in previous sessions. Below this, 1.4850 could provide further support.
Resistance Levels: The nearest resistance is at 1.5170, a critical level that the pair has struggled to break. If EUR/CAD manages to close above this level, it could test the next resistance at 1.5270, marking the upper boundary of recent price action.


Conclusion and Consideration:
The EUR/CAD analysis suggests a cautious approach as the pair continues to consolidate near key support. Fundamental factors such as Canadian oil price movements and Eurozone inflation will play a significant role in shaping the direction of the pair. While technical indicators like the MACD and Bollinger Bands suggest the possibility of a breakout, traders should wait for confirmation before entering new positions. Prudent risk management is advised, with close attention to the 1.4900 support and 1.5170 resistance levels for potential breakout signals.


Disclaimer: The provided analysis is for informational purposes only and does not constitute investment advice. Traders should conduct their own research and analysis before making any trading decisions.


FXGlory
10.01.2024
 
EURUSD H4 Technical and Fundamental Analysis for 10.02.2024


EURUSD-H4-Chart-Daily-Technical-and-Fundamental-Analysis-for-10-02-2024.jpg


Time Zone: GMT +3
Time Frame: 4 Hours (H4)


Fundamental Analysis:


The EUR/USD forex pair, also known as “Fiber,” reflects the relative strength of the Eurozone and US economies. Currently, the market is focused on macroeconomic data such as employment figures, inflation rates, and central bank policies. Upcoming releases, such as France’s government budget balance and unemployment data across key European economies, are critical for Euro traders. On the US side, employment data (ADP) and Federal Reserve speeches will significantly impact the US Dollar’s performance. Any stronger-than-expected ADP job growth or hawkish Fed commentary could strengthen the USD, putting further pressure on the EUR/USD forecast today.


Price Action:

The EUR/USD H4 chart has been in a downtrend within a descending channel. The pair’s price action has been unable to breach the 1.1153 resistance level and is now testing support around 1.1068. The continuation of lower highs and lower lows within the channel indicates the Fiber’s strong bearish momentum, with no immediate signs of reversal. The price is hovering near the lower boundary of the channel, suggesting potential further downside movement if the support level breaks.


Key Technical Indicators:

RSI (Relative Strength Index):


The RSI is currently at 36.73, indicating the pair is approaching oversold conditions. While this suggests bearish momentum, it also implies that a relief rally could be on the horizon, especially if the RSI dips below 30.

MACD (Moving Average Convergence Divergence):

The MACD histogram is negative, with the MACD line below the signal line, reinforcing the pair’s bearish outlook. The increasing distance between the two lines suggests that bearish momentum is still strong, with no immediate signs of reversal.


Support and Resistance:

Support Levels:


Immediate support is seen at 1.1068, followed by stronger support at 1.1005, which could act as a critical level if the bearish trend continues.

Resistance Levels:

The nearest resistance stands at 1.1153, with the next significant resistance level around 1.1200 if the price manages to reverse the current downtrend.


Conclusion and Consideration:

The EUR/USD technical analysis today is displaying its strong bearish signals on the H4 timeframe, with both MACD and RSI indicators supporting the downward momentum. However, with the RSI nearing oversold conditions, a short-term pullback could be expected, but the overall EURUSD outlook remains bearish unless key resistance levels are breached. Traders should watch upcoming US employment data and Federal Reserve speeches for further direction. Risk management is crucial, especially given the volatile nature of the pair.


Disclaimer: The provided analysis is for informational purposes only and does not constitute investment advice. Traders should conduct their own research and analysis before making any trading decisions.


FXGlory
10.02.2024
 
NZDUSD H4 Technical and Fundamental Analysis for 10.03.2024


NZDUSD_H4_Chart_Daily_Technical_and_Fundamental_Analysis_for_10.jpg


Time Zone: GMT +3
Time Frame: 4 Hours (H4)


Fundamental Analysis:


The NZD/USD forex pair, also known as “Kiwi,” is often influenced by commodity prices and global risk sentiment, and continues to be impacted by macroeconomic data from both New Zealand and the U.S. Today, traders are watching upcoming U.S. reports, including jobless claims and the job cut announcements, which will provide insight into the U.S. labor market's health. Stronger-than-expected data could bolster the U.S. dollar, as it reflects an improving economy and increases the likelihood of further tightening by the Federal Reserve. On the New Zealand side, global commodity prices, particularly those of agricultural goods and dairy products, remain a key driver for the NZD. With the latest ANZ Commodity Price Index on the horizon, any significant changes in global prices could have a direct impact on the Kiwi’s forecast today.


Price Action:

The NZD/USD H4 chart shows a clear downtrend, with the pair moving within a descending channel. The pair’s price has been consistently forming lower highs and lower lows, reflecting persistent bearish sentiment. The pair recently broke below a key support level of 0.6296, which has now turned into resistance. Current NZDUSD price action suggests that bearish momentum may continue unless a clear reversal signal appears.


Key Technical Indicators:

RSI (Relative Strength Index):


The RSI is currently at 35.99, which indicates that the pair is approaching oversold conditions. However, there is still room for further downside before the RSI reaches extreme levels, suggesting that the pair’s bearish momentum could persist in the short term.

Stochastic Oscillator: The Stochastic oscillator is at 16.69, deep in the oversold zone. This suggests that while the pair remains under selling pressure, a potential bullish reversal could be on the horizon if buyers step in at these levels.

MACD (Moving Average Convergence Divergence):

The MACD is in negative territory, with the histogram showing increased downward pressure. The MACD line is below the signal line, indicating a continuation of the bearish trend.


Support and Resistance:

Support Levels:


The nearest support level is at 0.6230, which aligns with the lower boundary of the descending channel. If this level breaks, further downside toward 0.6175 could be expected.

Resistance Levels:

The immediate resistance is now at 0.6296. A break above this level would indicate a shift in sentiment and could signal the start of a bullish correction.


Conclusion and Consideration:

The NZD/USD technical analysis today shows the pair remains in a strong downtrend on the H4 timeframe, with key technical indicators pointing to its continued bearish pressure. The RSI and Stochastic oscillator both suggest the pair is nearing oversold conditions, hinting at a possible short-term reversal. However, as long as the price remains below the resistance level of 0.6296, the bearish momentum is likely to continue. Traders should watch for upcoming U.S. data releases, as stronger-than-expected numbers could further strengthen the U.S. dollar, putting additional pressure on the Kiwi. Risk management is crucial in this volatile environment, and traders should consider setting stop losses near key support and resistance levels.


Disclaimer: The provided analysis is for informational purposes only and does not constitute investment advice. Traders should conduct their own research and analysis before making any trading decisions.


FXGlory
10.03.2024
 
BTC/USD H4 Technical and Fundamental Analysis for 10.04.2024


Time Zone: GMT +3
Time Frame: 4 Hours (H4)


Fundamental Analysis:

The BTCUSD forex pair reflects the exchange rate between Bitcoin (BTC) and the US Dollar (USD), a crucial instrument for cryptocurrency traders. Today’s market is poised for volatility due to significant economic releases in the US, including Non-Farm Payrolls (NFP) and the Unemployment Rate. These reports are essential indicators of economic strength, and a higher-than-expected NFP figure or lower unemployment rate may support the USD, leading to downward pressure on BTC/USD. Additionally, remarks from Federal Reserve Bank of New York President John Williams are anticipated, with any hawkish tone likely strengthening the USD. As labor inflation data is released, it could also contribute to volatility in the cryptocurrency market, as USD strength generally puts downward pressure on Bitcoin prices.


Price Action:
Looking at the BTC USD H4 chart, the price has been in a consistent downtrend after failing to maintain its bullish momentum from earlier weeks. The pair is currently trading below the Ichimoku cloud, a clear indication of bearish dominance. A descending trendline is capping any attempts for recovery, further confirming the bearish outlook. Price has been consolidating just above the 50% Fibonacci retracement level at $60,050, indicating a potential battle between buyers and sellers. If the price remains below this key support, the bears may push it lower, toward the 61.8% Fibonacci level at $58,483.


Key Technical Indicators:
Ichimoku Cloud:
The price is currently below the Ichimoku cloud, which indicates bearish market conditions. The cloud itself is red and growing, suggesting that bearish momentum is likely to continue in the short term. The lagging span and future cloud are both below price action, adding to the negative outlook.

MACD (Moving Average Convergence Divergence): The MACD indicator shows bearish momentum, with the MACD line well below the signal line. The histogram is negative, and while it is contracting slightly, there’s no indication of a bullish crossover soon. This reinforces the bearish trend and suggests continued downward pressure.

%R Indicator (Williams %R): The %R is currently around the -70 mark, indicating that the market is in bearish territory but not yet oversold. This suggests that there is still room for the price to decline further before a potential reversal or consolidation.


Support and Resistance:
Support Levels:
Immediate support is located at the 50% Fibonacci retracement level at $60,050. If this level breaks, the next significant support lies at the 61.8% Fibonacci level at $58,483. A failure to hold this could see the pair dropping towards $56,000.
Resistance Levels: On the upside, resistance is found at the descending trendline around $61,800. Above this, the next major resistance is at the 38.2% Fibonacci retracement level at $61,897, coinciding with the lower boundary of the Ichimoku cloud.


Conclusion and Consideration: The BTC/USD H4 chart indicates a bearish bias in the market, with price trading below key technical levels, including the Ichimoku cloud and major Fibonacci retracement points. Bearish momentum appears strong, as confirmed by the MACD and %R indicators. However, any upside surprise in today’s US economic releases, particularly the NFP or unemployment figures, could add further downside pressure on Bitcoin. Traders should remain cautious as the market could see heightened volatility due to these upcoming fundamental drivers. The key support at $60,050 will be critical to watch, as a break below could signal deeper corrections toward $58,483.


Disclaimer: The provided analysis is for informational purposes only and does not constitute investment advice. Traders should conduct their own research and analysis before making any trading decisions.


FXGlory
10.04.2024
 
AUDUSD H4 Technical and Fundamental Analysis for 10.07.2024


AUDUSD_H4_Chart_Daily_Technical_and_Fundamental_Analysis_for_10.jpg


Time Zone: GMT +3
Time Frame: 4 Hours (H4)


Fundamental Analysis:


The AUD/USD forex trading pair, also known as the “Aussie”, continues to experience significant movements, as the pair’s fundamental forecast is influenced by various factors impacting both the Australian and US economies. Recently, US Federal Reserve officials, including Michelle Bowman and Neel Kashkari, have provided hawkish views regarding the US economy and future interest rate hikes. These statements are strengthening the USD, putting downward pressure on the Australian dollar. Moreover, a US Consumer Credit report is anticipated, which may further support the USD if consumer debt levels exceed expectations. In Australia, markets are adjusting to the observance of Labor Day in some states, contributing to lower liquidity and increased volatility. On the economic front, Melbourne Institute data on consumer price inflation is also relevant, as it could signal future adjustments in Australian monetary policy, especially given the RBA’s focus on inflation control.


Price Action:

the AUD/USD H4 candle chart, shows the pair is trending downward within a well-defined bearish channel, having failed to break the upper resistance around 0.6840. The pair is currently trading near 0.6794, approaching a significant support level of 0.6770. The Aussi’s price action shows a clear pattern of lower highs and lower lows, confirming its bearish market sentiment. Buyers are attempting to regain control, but the prevailing market momentum suggests that the downtrend is still dominant.


Key Technical Indicators:

Bollinger Bands:


The price is currently close to the lower Bollinger Band, which may act as a short-term dynamic support. The bands are widening, indicating increasing volatility in the market. A breakdown below the lower band could signify continued AUDUSD bearish pressure, while a bounce might suggest a temporary reversal or consolidation.

MACD (Moving Average Convergence Divergence):

The MACD line has crossed below the signal line, with the histogram showing a growing negative divergence. This suggests that the bearish momentum is still intact, and further downside is likely unless there is a strong reversal in the coming sessions.


Support and Resistance:

Support Levels:


The immediate support is at 0.6770, which aligns with recent price action and the lower Bollinger Band. If this level breaks, the next major support could be found around 0.6700, a key psychological level.

Resistance Levels:

The closest resistance is at 0.6840, near the middle Bollinger Band. A successful breach above this level would suggest a potential recovery, but strong resistance is expected at the 0.6885 level.


Conclusion and Consideration:

The AUD/USD technical analysis today shows the ongoing bearish trend, supported by strong downward momentum in both the pair’s price action and its technical indicators. The widening Bollinger Bands and bearish MACD signal suggest that the pair may face further downward pressure, especially if the 0.6770 support level is breached. However, traders should be cautious of any potential rebounds from the lower Bollinger Band or support levels, which may trigger short-term corrections. The upcoming US economic data and Australian inflation reports could further influence the AUDUSD market direction. Given the current market conditions, employing risk management strategies, such as stop-loss orders, is crucial in navigating this volatile environment.


Disclaimer: The provided analysis is for informational purposes only and does not constitute investment advice. Traders should conduct their own research and analysis before making any trading decisions.


FXGlory
10.07.2024
 
EUR/USD H4 Technical and Fundamental Analysis for 10.08.2024


Time Zone: GMT +3
Time Frame: 4 Hours (H4)


Fundamental Analysis:

Today’s economic data releases from the Eurozone and the U.S. will likely influence the direction of the EUR/USD pair. For the Euro, German Industrial Production data reported a surprising increase of 0.8% after previously contracting by -2.4%, signaling a recovery in the manufacturing sector. This positive data, along with ECOFIN meetings and a speech by the German Bundesbank President, could boost sentiment toward the Euro.
From the U.S. side, the trade balance narrowed to -70.1B from -78.8B, reflecting improving economic conditions, which could support the U.S. Dollar. Additionally, FOMC members Kugler, Bostic, and Collins are scheduled to speak today, potentially providing insights into the Federal Reserve's future monetary policy stance. Markets will also watch the NFIB Small Business Index, expected to rise to 92.0, which could further influence USD sentiment.


Price Action:
On the H4 chart, EUR/USD has been trading in a downtrend since mid-September, with the price currently hovering near the 1.0970 level. The Bollinger Bands indicate that the pair is oversold as the price touched the lower band, suggesting that a possible rebound could be on the horizon. Despite the recent bounce, the pair remains below key moving averages, reflecting overall bearish momentum.
The MACD shows continued bearishness, with the histogram below zero and declining. However, as the pair approaches key support levels, there could be a corrective movement if buyers manage to defend these levels.


Key Technical Indicators:
Bollinger Bands:
The price has touched the lower band, indicating potential oversold conditions and a possible corrective bounce.
MACD: The indicator remains bearish, with the histogram and MACD line below the signal line, confirming ongoing selling pressure.


Support and Resistance:
Support Levels:
Key support is located at 1.0945, with further support around 1.0890. A break below these levels could open the door for further declines toward 1.0865.
Resistance Levels: Immediate resistance is seen at 1.1020, which coincides with the middle Bollinger Band. A breakout above this level could push the pair toward the next resistance at 1.1080.


Conclusion and Consideration:
The EUR/USD H4 chart suggests a continuation of the bearish trend unless the pair manages to break above the immediate resistance levels. A bounce from the 1.0945 support could signal a potential correction, but the broader trend remains bearish. Traders should closely monitor today's speeches from FOMC members and U.S. trade balance data, as these could provide further direction to the pair.


Disclaimer: The provided analysis is for informational purposes only and does not constitute investment advice. Traders should conduct their own research and analysis before making any trading decisions.


FXGlory
10.08.2024

 
NZDUSD H4 Technical and Fundamental Analysis for 10.09.2024


NZDUSD_H4_Chart_Daily_Technical_and_Fundamental_Analysis_for_1009.jpg

Time Zone: GMT +3
Time Frame: 4 Hours (H4)


Fundamental Analysis:


The NZD/USD forex trading pair, also known as the "Kiwi," always has its fundamental outlook heavily influenced by factors from both the New Zealand and U.S. economies. For the NZD/USD news analysis today, traders are focused on speeches by key Federal Reserve members such as Philip Jefferson and Raphael Bostic. Any hawkish tone could further strengthen the U.S. dollar, applying pressure on the NZD/USD forecast today. Additionally, the Reserve Bank of New Zealand (RBNZ) interest rate policy, along with global risk sentiment, particularly commodity prices, plays a crucial role in driving the Kiwi. Rising interest rates in the U.S. can create a widening yield differential, pushing the pair lower. Meanwhile, data on U.S. crude inventories and wholesale inventories can influence broader USD demand, affecting the pair's movements.


Price Action:

The NZD/USD H4 chart shows a clear downward channel, indicating the pair’s strong bearish trend over the past several sessions. The Kiwi’s price action has made consistent lower highs and lower lows, adhering closely to the boundaries of this bearish channel. Recently, the pair has found temporary support around the 0.6119 level, but it struggles to maintain any upward momentum. Short-term recovery attempts are capped, and the overall structure suggests that selling pressure remains dominant.


Key Technical Indicators:

RSI (Relative Strength Index):


The RSI is currently at 33.68, indicating that the pair is in the oversold territory. This could suggest a possible short-term corrective bounce; however, the overall bearish momentum might continue unless the RSI moves back above the 50 level, confirming a shift in the pair’s sentiment.

Ichimoku Cloud:

The Ichimoku Cloud shows a clear bearish sentiment, with the price well below the cloud, indicating continued downside pressure. The Tenkan-sen line (red) is below the Kijun-sen line (blue), reinforcing the NZDUSD bearish outlook. The Lagging Span is also below the price, confirming that the current trend is bearish. However, the pair’s proximity to key support levels may lead to some consolidation.


Support and Resistance:

Support Levels:


The key support levels are 0.6119 and 0.6070. If the price breaks below these levels, the next major support could be around 0.6000.

Resistance Levels:

On the upside, resistance is seen at 0.6141, followed by 0.6160. Any break above these levels may result in short-term bullish momentum, though the broader trend remains bearish.


Conclusion and Consideration:

The NZD/USD H4 candle chart analysis today confirms that the pair is firmly entrenched in a bearish trend, with key technical indicators like the RSI and Ichimoku cloud reinforcing this sentiment. Although the RSI is approaching oversold territory, suggesting a potential short-term bounce, the overall bias remains bearish unless there is a significant change in the pair’s momentum. Traders should closely monitor upcoming U.S. data and Fed speeches for any signs of USD strength or weakness that could influence the NZD-USD fundamental movements. It's crucial to keep an eye on key support levels, as a break below them could open the door to further downside. Conversely, a break above resistance might offer a temporary relief rally.


Disclaimer: The provided analysis is for informational purposes only and does not constitute investment advice. Traders should conduct their own research and analysis before making any trading decisions.


FXGlory
10.09.2024
 
USDJPY H4 Technical and Fundamental Analysis for 10.10.2024


Time Zone: GMT +3
Time Frame: 4 Hours (H4)


Fundamental Analysis:

The USD/JPY currency pair, also known as the “Gopher,” always has its daily fundamental forecast significantly influenced by monetary policy from both the Federal Reserve (Fed) and the Bank of Japan (BoJ). Today, several key events, including speeches by Federal Reserve members, like Susan Collins and Mary Daly, are expected to provide subtle clues regarding future US monetary policy, which could impact USD volatility. Hawkish commentary from these officials could strengthen the USD. In contrast, the BoJ’s recent measures to stabilize lending and corporate price adjustments will affect JPY strength, as traders monitor Japan's economic performance. Inflation reports and unemployment data from the US are also set to influence market movements in the short term, further shaping the USD/JPY direction.


Price Action:
On the USD/JPY H4 candle chart, we can see the pair’s bullish trend, moving within a rising channel. The Gopher’s price action is consistently making higher highs and higher lows, reflecting its strong bullish momentum. The pair is approaching a key resistance level at 149.860, which, if broken, could signal continued bullish pressure toward the 150.915 level. However, a rejection from this level could see a retracement back toward the lower boundary of the ascending channel.


Key Technical Indicators:
Stochastic Oscillator:
The stochastic is hovering in overbought territory, currently around 91.17, signaling potential exhaustion in the uptrend. This could mean a possible short-term pullback or correction is on the horizon before any further USDJPY upward movement.
Volume: Recent volume analysis shows a gradual increase in bullish activity, supporting the ongoing uptrend. However, any divergence between the pair’s price action and its volume could hint at a reversal or weakening of the trend.


Support and Resistance:
Support Levels:
The first support level is at 148.929, aligned with the lower boundary of the ascending channel. A break below this level could lead to further declines, testing the support at 148.200.
Resistance Levels: The next key resistance is located at 149.860, with the potential for further movement toward 150.915 if bullish momentum continues.


Conclusion and Consideration:
The USD/JPY analysis today is clearly displaying strong bullish momentum on its H4 chart, driven by the pair’s fundamental and technical factors. Traders should keep an eye on the upcoming speeches by Fed officials, which may provide insight into future interest rate decisions that could push the pair higher. However, with the stochastic oscillator in overbought territory, caution is advised, as there may be a short-term pullback before a continuation of the upward trend. Monitoring support levels and key resistance around 149.860 will be essential for determining potential trading opportunities. Implementing proper risk management strategies, including stop-losses near key support levels, is crucial given the market’s volatility.


Disclaimer: The provided analysis is for informational purposes only and does not constitute investment advice. Traders should conduct their own research and analysis before making any trading decisions.


FXGlory
10.10.2024
 
USDCAD Daily Technical and Fundamental Analysis for 10.11.2024


Time Zone: GMT +3
Time Frame: 4 Hours (H4)


Fundamental Analysis:

Today, several key factors influence the USD/CAD pair. U.S. data includes the Producer Price Index (PPI), which is a critical indicator of inflation at the producer level. A higher-than-expected PPI result would likely strengthen the U.S. Dollar, reinforcing expectations for a hawkish Federal Reserve stance. In addition, speeches by Federal Reserve members such as Austan Goolsbee and Michelle Bowman may provide further insight into the Fed's monetary policy, impacting USD strength. On the CAD side, economic activity will be affected by labor market data, including employment change and unemployment rates. If Canadian data disappoints, it could weigh on the Canadian dollar, pushing the USD/CAD pair higher.


Price Action:
In recent days, the USDCAD pair has been in a strong uptrend, consistently making higher highs and higher lows. The price is moving within an ascending channel, as seen in the H4 timeframe, with momentum driving the pair above the key Fibonacci retracement levels. A minor pullback is observed at the upper boundary of the channel, but bullish momentum remains strong as the pair continues trading above the 50% Fibonacci retracement.


Key Technical Indicators:
Ichimoku Cloud:
The price is trading well above the Ichimoku Cloud, confirming a strong bullish trend. Both the Tenkan-sen and Kijun-sen lines are pointing upwards, reinforcing the positive momentum. The Chikou Span also confirms the bullish trend as it stays above the price action, indicating that the trend is likely to continue in the near term.
MACD (Moving Average Convergence Divergence): The MACD line remains above the signal line, confirming ongoing bullish momentum. However, the MACD histogram is starting to flatten, suggesting that the momentum might be weakening slightly. Traders should be cautious of a possible bearish crossover, which could indicate a slowing trend.
Williams %R: The Williams %R indicator is currently approaching overbought territory, indicating that the USDCAD pair could be overextended in the short term. While this reflects strong buying pressure, it also signals a possible correction. A move below the -20 level may signal the beginning of a pullback.


Support and Resistance Levels:
Support:
The nearest support level is located at 1.3700, which aligns with the 50% Fibonacci retracement level and the lower bound of the ascending channel. A further decline may find stronger support at 1.3650, which is close to the 38.2% Fibonacci retracement.
Resistance: The immediate resistance is at 1.3780, near the recent highs. A break above this level could push the pair towards 1.3830, which aligns with the 61.8% Fibonacci retracement level and the top boundary of the current channel.


Conclusion and Consideration:
The USDCAD pair on the H4 chart remains in a strong bullish trend, supported by the Ichimoku Cloud, MACD, and Williams %R indicators. While the pair shows some signs of potential short-term overextension, the broader trend continues to favor the bulls. Traders should keep an eye on today’s USD and CAD economic releases, which could drive further volatility, particularly if U.S. PPI data or Fed member speeches signal a hawkish stance. As always, keeping track of key support and resistance levels will be crucial for managing risk and identifying potential trading opportunities.


Disclaimer: This analysis of USDCAD is intended for informational purposes only and does not constitute financial advice. Currency trading involves significant risk, and market conditions can change rapidly. Traders should perform their own research and analysis before making any trading decisions.


FXGlory
10.11.2024
 
BTCUSD Daily Technical and Fundamental Analysis for 10.14.2024


Time Zone: GMT +3
Time Frame: 4 Hours (H4)


Fundamental Analysis:

The BTC/USD pair represents the exchange rate between Bitcoin and the US Dollar. Today, market liquidity for BTC USD may be lower due to the Columbus Day holiday in the US, which typically results in less market activity. This could lead to irregular volatility in the cryptocurrency markets, especially with the absence of major institutional traders. However, volatility may pick up later as Neel Kashkari, the President of the Federal Reserve Bank of Minneapolis, is scheduled to speak about fiscal deficits and monetary policy at a conference in Argentina. His comments may offer insights into future US interest rate decisions, which could impact USD strength and, consequently, BTCUSD pair. In the coming days, the focus will be on any hawkish statements from other Federal Reserve officials, which could push the dollar higher and apply pressure on Bitcoin prices.


Price Action:
In the H4 time frame, BTCUSD has been showing signs of a bullish trend, as recent candles have been predominantly positive. The BTC USD price is currently moving between the 23.6% and 38.2% Fibonacci retracement levels, suggesting a continuation of the upward trend. After a strong push from the 50% Fibonacci level, the price broke above the 38.2% level and is now testing the 23.6% retracement, a key area of interest for traders. The BTCUSD price action suggests that buyers are regaining control, with the possibility of pushing the price higher if BTC-USD candle successfully holds above these retracement levels.


Key Technical Indicators:
Bollinger Bands:
The BTC/USD price is trading within an upward trend, supported by widening Bollinger Bands, indicating increasing volatility. The price is moving closer to the upper band, signaling strong bullish momentum. Over the last few candles, the price has remained between the 38.2% and 23.6% Fibonacci retracement levels, which aligns with the positive price movement.
Parabolic SAR: The Parabolic SAR indicator shows a strong bullish sentiment, with the last seven dots forming below the candles. This indicates upward momentum and suggests that the current uptrend is likely to continue in the short term.


Support and Resistance Levels:
Support:
Immediate support is located at $60,947 (50% Fibonacci level), followed by the next key support at $59,271 (61.8% Fibonacci level).
Resistance: Immediate resistance is seen at $63,385 (23.6% Fibonacci level). A break above this level could push BTC/USD toward the next psychological resistance near $66,000.


Conclusion and Consideration:
The BTCUSD forex pair shows strong bullish momentum on the H4 chart, supported by key indicators like Bollinger Bands and the Parabolic SAR, both signaling upward price movement. However, caution is advised due to irregular volatility stemming from the US bank holiday and potential market-moving comments from Federal Reserve officials. Traders should monitor the 23.6% Fibonacci resistance level closely, as a break above could open the doors for further gains. Additionally, market participants should stay alert to any sudden shifts in USD strength due to upcoming speeches that may affect interest rate expectations.


Disclaimer: The analysis provided for BTC/USD is intended for educational purposes and does not constitute financial advice. Traders should perform their own research and analysis before making any trading decisions. Market conditions can change rapidly, and it's essential to stay updated on current events.


FXGlory
10.14.2024
 
NZDUSD Daily Technical and Fundamental Analysis for 10.15.2024


Time Zone: GMT +3
Time Frame: 4 Hours (H4)


Fundamental Analysis:

The NZDUSD pair reflects the exchange rate between the New Zealand Dollar and the US Dollar. The New Zealand Dollar has been under pressure recently, driven by concerns around slowing economic growth in New Zealand and ongoing global uncertainties. Traders are awaiting potential signals from the Reserve Bank of New Zealand (RBNZ) regarding future interest rate policy, with inflation remaining a key concern. The latest inflation data showed stability, but the market is still uncertain about how the RBNZ will respond, especially if global risks intensify.
In the US, the upcoming speeches by Federal Reserve officials, including FOMC members Daly and Kugler, will be closely watched. These speeches may provide insights into the Federal Reserve's stance on interest rate hikes and inflation control. If the tone remains hawkish, it could strengthen the US Dollar, applying further pressure on the NZDUSD pair. Additionally, any developments in global commodity prices, particularly dairy and energy prices, could influence the New Zealand Dollar, given its heavy reliance on commodity exports.


Price Action:
In the H4 timeframe, NZDUSD is displaying signs of consolidation after experiencing a minor recovery from recent lows. The pair is currently trading near a key support zone, but recent candles show mixed sentiment, with neither bulls nor bears firmly in control. Price action suggests that the pair is waiting for a catalyst, such as central bank comments or economic data, before making a decisive move. NZDUSD has recently bounced off a critical support area near 0.60500, but is struggling to break through resistance around 0.61000.


Key Technical Indicators:
MACD:
The MACD shows weak bullish momentum, with the MACD line slightly above the signal line. However, the histogram is showing low levels of activity, indicating that the upward trend lacks strong momentum, and a reversal could occur if the fundamentals shift.
RSI: The Relative Strength Index (RSI) is hovering around 50, indicating a neutral stance. This suggests that the pair is neither overbought nor oversold, leaving room for movement in either direction depending on market catalysts.


Support and Resistance Levels:
Support:
The immediate support level is located at 0.60500, where the pair has found recent buying interest. Below that, stronger support can be found at 0.59400, a key psychological level.
Resistance: Resistance lies at 0.61000, a level that has capped gains in recent sessions. A break above this could open the door to a retest of 0.61400, a significant round number that could attract further buying interest if breached.


Conclusion and Consideration:
NZDUSD is in a neutral stance, consolidating around key support levels in the H4 timeframe. The MACD is signaling weak bullish momentum, while the RSI suggests there is still room for movement in either direction. Traders should closely monitor upcoming FOMC member speeches, as any hawkish comments from the Federal Reserve could strengthen the US Dollar, pushing NZDUSD lower. Meanwhile, any dovish signals or supportive RBNZ commentary could provide a short-term boost to the New Zealand Dollar. The pair remains vulnerable to fluctuations in global risk sentiment and commodity prices, which could act as a catalyst for future movements. Traders should be cautious and monitor support and resistance levels closely for any potential breakouts.


Disclaimer: The analysis provided for NZDUSD is intended for educational purposes and does not constitute financial advice. Traders should perform their own research and analysis before making any trading decisions. Market conditions can change rapidly, and it's essential to stay updated on current events.


FXGlory
10.15.2024
 
Last edited:
EURGBP H4 Technical and Fundamental Analysis for 10.16.2024


EURGBP_H4_Chart_Daily_Technical_and_Fundamental_Analysis_for_10.jpg


Time Zone: GMT +3
Time Frame: 4 Hours (H4)


Fundamental Analysis:


The EUR/GBP news analysis today is as always influenced by the macroeconomic landscapes of both the Eurozone and the United Kingdom, reflecting the latest economic developments. On the GBP side, upcoming UK inflation data, particularly the Consumer Price Index (CPI) due on November 20, 2024, remains a crucial driver. Higher-than-expected inflation readings could push the Bank of England towards further monetary tightening, potentially strengthening the British pound. Meanwhile, for the Euro, attention is focused on the ECB’s future policy, where investors are monitoring remarks by ECB President Christine Lagarde regarding interest rates and economic outlook. As both economies deal with inflationary pressures, traders must assess the pair’s key fundamentals to anticipate future EUR/GBP movements.

Price Action:

The EUR/GBP H4 chart has seen a consistent downtrend over the past few sessions. The pair’s price action shows a consolidation phase following a significant decline, with the price hovering near a key support level of 0.83190. The current EURGBP technical analysis suggests a lack of strong momentum in either direction, indicating indecision in the market. If prices break below this support level, further downside can be expected, while a sustained move above the 0.83295 resistance could signal a reversal or a consolidation phase.


Key Technical Indicators:

Ichimoku Cloud:


The price is trading below the Ichimoku cloud, suggesting the pair’s bearish sentiment. The cloud itself remains bearish, with future levels still below the current price, indicating that downside pressure may persist unless a clear breakout occurs.

RSI (Relative Strength Index):

The RSI stands at 47.32, indicating neutral conditions. This suggests that the market is neither overbought nor oversold, giving room for movement in either direction depending on fundamental news.

MACD (Moving Average Convergence Divergence):

The MACD histogram is slightly negative, with the MACD line below the signal line, reinforcing the bearish momentum. However, the histogram shows signs of flattening, which could suggest a potential reduction in bearish momentum if upcoming data favors the Euro.


Support and Resistance:

Support Levels:


The support level at 0.83190 is a critical level that, if broken, could lead to further declines.

Resistance Levels:

The resistance at 0.83295 is the Immediate resistance that needs to be overcome for any meaningful upside movement, and the resistance at 0.83585 is a higher resistance level that would act as a strong barrier if prices recover.


Conclusion and Consideration:

The EUR/GBP forecast today is suggesting that the pair will remain in a bearish phase, as highlighted by the Ichimoku cloud and MACD indicators. However, with the RSI showing neutral conditions and the MACD histogram flattening, traders should be cautious about potential reversals or consolidation. The upcoming UK inflation data and any hints from the ECB will play pivotal roles in determining the pair's next move. A break below the 0.83190 support would confirm continued bearishness, while a push above 0.83295 could signal a shift towards a more neutral or bullish EUR/GBP outlook. As always, risk management is essential, particularly with key economic data on the horizon.


Disclaimer: The provided analysis is for informational purposes only and does not constitute investment advice. Traders should conduct their own research and analysis before making any trading decisions.


FXGlory
10.16.2024
 

Create an account or login to comment

You must be a member in order to leave a comment

Create account

Create an account on our community. It's easy!

Log in

Already have an account? Log in here.

Similar threads

Users Who Are Viewing This Thread (Total: 4, Members: 0, Guests: 4)

Top
AdBlock Detected

We get it, advertisements are annoying!

Sure, ad-blocking software does a great job at blocking ads, but it also blocks useful features of our website. For the best site experience please disable your AdBlocker.

I've Disabled AdBlock    No Thanks