FXGlory Ltd
Member
EURNZD analysis 29.11.2023
Time Zone: GMT +2
Time Frame: 4 Hours (H4)
Fundamental Analysis:
The EURNZD pair reflects the economic interaction between the Eurozone and New Zealand, where trade balance, relative interest rates, and commodity prices, especially dairy for New Zealand and economic health indicators for the Eurozone, play significant roles. The recent price movement could be reacting to the Eurozone's monetary policy adjustments or shifts in New Zealand's export volumes. Analysts should factor in the potential impact of COVID-19 recovery paths and the differing fiscal stimuli, which could lead to volatility in the pair's exchange rate.
Price Action:
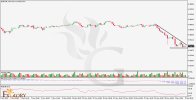
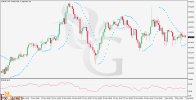
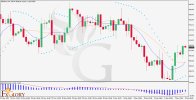
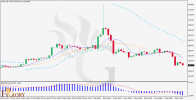
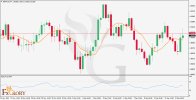
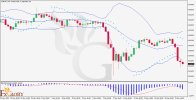
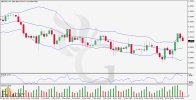
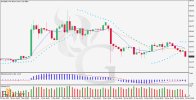
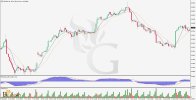
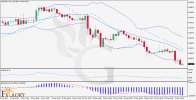
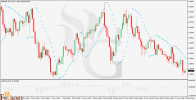
The EURNZD H4 chart displays a descending trend with bearish momentum, as indicated by the series of lower highs and lower lows. The recent price bars show an attempt to stabilize, suggesting a possible pause or reversal of the current downtrend. The market sentiment may be shifting, which is crucial for traders to monitor for confirmation of trend continuation or reversal.
Key Technical Indicators:
OsMA: The OsMA shows a consistent reading below the zero line, indicating bearish momentum, but the decreasing depth of the bars could signal a slowdown in downward pressure.
Parabolic SAR: The dots positioned above the price action denote a bearish trend; however, the recent contraction in distance between the dots and the price suggests the downtrend is losing strength.
Support and Resistance:
Resistance: The key resistance can be identified near the 1.8300 zone, which has acted as a barrier for price advances in the past.
Support: The immediate support level is around 1.7920, where the price has shown some rebound.
Conclusion and Consideration:
The technical analysis of the EURNZD on the H4 chart suggests a bearish trend with signs of potential exhaustion as the price attempts to stabilize. While the OsMA indicates ongoing bearish momentum, the Parabolic SAR hints at a weakening trend. Traders should approach with caution, considering the possibility of a trend reversal or pullback, and keep an eye on upcoming fundamental releases that could impact the Euro and New Zealand dollar, paying particular attention to the established support and resistance levels.
Disclaimer: This analysis is for informational purposes only and is not intended as investment advice. Trading involves risks and it is recommended that individuals conduct their own research and consult with financial advisors before making trading decisions.
FXGlory
29.11.2023


