What's new

Daily Market Analysis and Overview by Unitedpips

5.00 star(s) 1 Vote
EURCAD Daily Analysis: Bearish Pressure Dominates the Market


Introduction to EUR/CAD
The EUR/CAD currency pair, representing the Euro against the Canadian Dollar, is a significant cross-currency pair in the forex market. It reflects the strength of the Eurozone's economy relative to Canada, with influences from commodities like oil affecting CAD performance due to Canada's status as a leading oil exporter. Traders frequently refer to EUR/CAD as a "commodity cross-pair" because of its sensitivity to global oil price movements and Eurozone economic data.


EUR CAD Market Overview
The EUR/CAD daily(1D) news outlook, suggests that the pair is navigating a period of consolidation amidst mixed economic signals from both the Eurozone and Canada. For the Euro, upcoming releases like French consumer spending data and industrial output figures could provide vital insights into the bloc's economic health. These indicators will likely influence the EURCAD daily forecast, especially given that consumer spending is a key driver of economic activity. Meanwhile, Canadian employment and unemployment data scheduled for release in early February are expected to guide CAD movements. As a commodity-linked currency, CAD may also be influenced by any shifts in global oil prices, which have remained relatively stable over the past few days. Today’s market focus includes how both economies are responding to broader global inflationary pressures and consumer spending trends.


EUR/CAD Technical Analysis
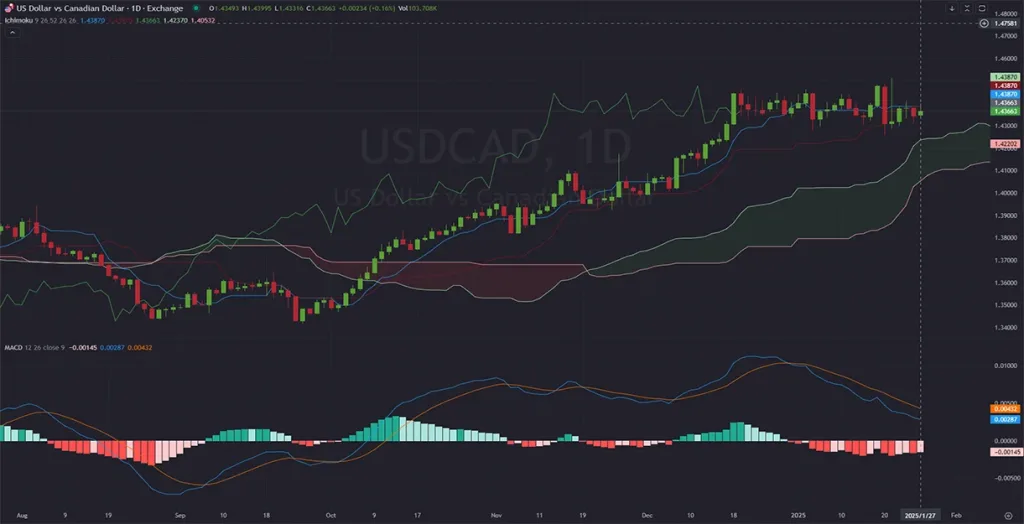
The daily(1D) EUR/CAD chart reveals a complex interplay between the pair’s price action, the Ichimoku cloud, and the MACD indicator. The Ichimoku cloud suggests bearish sentiment, with the price trading below the Kumo cloud, a sign of downward pressure. The Tenkan-sen and Kijun-sen lines are also pointing downward, further supporting EURCAD’s bearish outlook. On the MACD, the histogram shows negative momentum, and the MACD line is below the signal line, signaling continued selling pressure. Key support is observed at the 1.4748 level, while resistance lies around 1.4908. The price currently appears indecisive near the support level, suggesting a potential breakout or consolidation phase. Traders should watch for confirmations before taking positions.


Final Words About EUR vs CAD
The EUR/CAD daily review shows the pair as remaining poised at a critical juncture, with fundamental and technical factors offering mixed signals. On the one hand, the Euro could find support if consumer spending data surpasses expectations, while stronger Canadian employment figures could bolster CAD strength. The EURCAD daily technical analysis indicates its bearish bias, but the support level at 1.4748 could trigger a rebound. Traders should closely monitor the MACD for further bearish or bullish crossovers and the Ichimoku cloud for any signs of reversal. Staying informed about oil price fluctuations will also be key for CAD traders. As always, risk management and position sizing are crucial in navigating the volatility of this cross-pair.


01.10.2025
 
Daily NZDUSD Analysis: Kiwi Faces Bearish Pressure


Introduction to NZD/USD
The NZD/USD currency pair, often referred to by traders as the “Kiwi,” represents the exchange rate between the New Zealand Dollar (NZD) and the United States Dollar (USD). As one of the major currency pairs in forex trading, it provides valuable insights into economic dynamics between the US and New Zealand. The Kiwi is heavily influenced by global risk sentiment, commodity prices, and central bank policies in both countries.


NZDUSD Market Overview
The NZDUSD pair is currently experiencing a bearish trend, as shown in the daily analysis. Recent news from the US highlights key economic updates, with the Treasury Budget revealing a significant government spending deficit. A higher-than-expected deficit generally favors the USD, adding to the pair's downward pressure. Meanwhile, New Zealand's latest Building Permits report pointed to a decline in approvals, reflecting potential economic softening in the construction sector. This data indicates a weakening Kiwi, particularly as construction plays a pivotal role in New Zealand's economic activity. Traders are advised to monitor upcoming economic releases such as the Treasury Budget Statement in February for the USD and New Zealand’s next round of building permits in early February.
01.13.2025-NZDUSD-D1-analysis and price action.jpg
NZD/USD Technical Analysis
On the technical front, the NZD/USD pair is firmly within a bearish trend channel on the daily chart. The NZD USD price currently trades in the lower half of the Bollinger Bands, signaling strong downside momentum. It is moving between the 0.786 and 1.0 Fibonacci retracement levels, reflecting significant bearish sentiment. The RSI sits near 32, hovering close to the oversold territory, suggesting that the downward movement may slow but is not yet reversing. The Williams %R indicator is also deeply negative, reinforcing the bearish outlook. Key support levels can be seen at 0.5520, while immediate resistance lies near the 0.5638 level, the median Bollinger Band. Any break below the 0.5520 level could accelerate the bearish momentum.


Final Words about NZD vs USD
In conclusion, the NZD/USD pair is likely to remain under pressure in the short term as fundamental and technical factors align in favor of the USD. The weakening New Zealand economic indicators, coupled with the stronger dollar driven by concerns over the US budget deficit, are likely to keep the NZD-USD pair in a downward trajectory. Traders should watch for potential consolidation at the current support levels and remain cautious of any unexpected economic announcements. Proper risk management is essential in such a volatile environment, as market sentiment can shift rapidly. Keeping a close eye on global trends, commodity prices, and central bank policies will be key for successfully navigating the NZD/USD market.


01.13.2025
 
EURUSD Price Action: Technical and Fundamental Insights


Introduction to EURUSD
The EURUSD pair, often referred to as "Fiber," represents the exchange rate between the Euro (EUR) and the US Dollar (USD). This major currency pair is one of the most actively traded pairs globally, offering insights into the relative strength of the European and US economies. The EUR/USD forex pair's movements are closely monitored by forex traders due to its significant liquidity and volatility, making it an essential indicator of global economic trends.


EUR USD Market Overview
The EUR USD pair is experiencing a strong bearish trend, as global economic developments weigh on its performance. On the USD side, traders are awaiting key releases, including the Producer Price Index (PPI) and insights from Federal Reserve officials, which could shape expectations of US monetary policy. These events could strengthen the dollar if inflationary pressures persist. For the EUR, recent data such as France’s General Budget Outcome and Italy’s Industrial Production figures show a mixed outlook for the Eurozone economy. The Fiber is under pressure, with market participants closely watching the interplay between these contrasting fundamentals. As of today, the EUR-USD pair hovers near multi-month lows, with upcoming economic data likely to provide further direction.


EUR/USD Technical Analysis
On the daily chart, EUR/USD remains firmly entrenched in a descending channel, demonstrating continued bearish momentum. The EUR USD price today has touched the lower Bollinger Band and 0.618 Fibonacci retracement level, signaling a possible short-term bounce. The last candle shows bullish pressure, but the overall trend remains bearish. The RSI (14) is currently at 34, suggesting the pair is nearing oversold territory, while the %R indicator also signals oversold conditions. However, these indicators reflect bearish market sentiment, with any upward correction likely to face resistance near the channel's upper boundary and the 0.5 Fibonacci level at 1.0386.


Final Words about EUR vs USD
The EURUSD pair continues to face downward pressure, driven by bearish fundamentals and technical indicators. While the recent bullish candle hints at a potential short-term recovery, the broader trend remains to the downside as the EUR/USD pair trades within a well-defined descending channel. Traders should monitor resistance levels at 1.0386 and support near 1.0189 for potential breakout signals. Upcoming economic data from both the US and the Eurozone will likely be decisive in determining the fiber's next direction. Risk management remains crucial, as volatility could increase with the release of high-impact news.


01.14.2025
 
USD/JPY Daily Outlook: Bullish Momentum Meets Overbought Signals


Introduction to USD/JPY
The USD/JPY currency pair, commonly referred to as the "Gopher," is one of the most actively traded pairs in the forex market. It represents the exchange rate between the US Dollar and the Japanese Yen, reflecting the economic dynamics of two of the largest economies in the world. Due to its high liquidity and volatility, the pair is favored by traders seeking both short-term opportunities and long-term trends.

USD JPY Market Overview
The USD/JPY daily fundamental analysis is influenced by recent economic data and upcoming events that shape the forex market's sentiment. In the US, the Consumer Price Index (CPI) figures are in focus, with traders awaiting insights into inflation trends and their potential impact on Federal Reserve monetary policy. Speeches by key Federal Reserve officials, including Thomas Barkin and Neel Kashkari, are expected to provide further clues about interest rate trajectories. On the Japanese side, the Bank of Japan's focus on price stability and corporate goods price index (CGPI) data are critical for assessing inflationary pressures in Japan. Recent trends suggest that while the USD retains strength due to hawkish Fed sentiment, the JPY faces challenges from relatively loose monetary policies. These developments set the stage for volatility as traders position themselves ahead of crucial economic releases.
USDJPY_Chart_Daily_Technical_and_Fundamental_Analysis_for_01_15.jpg
USD-JPY Technical Analysis
On the USD/JPY daily chart, it is trading near a significant resistance level around 158.00, with Ichimoku Cloud analysis highlighting a potential consolidation phase. The Gopher’s price action is trading above the cloud, which is generally a bullish signal; however, the proximity to resistance suggests caution. The Tenkan-Sen (blue line) is above the Kijun-Sen (red line), confirming upward momentum, but the lagging span (Chikou Span) is nearing a critical level. The Stochastic RSI indicates that the pair is in overbought territory, with potential for a corrective pullback if momentum weakens. Key support levels to watch include 155.00, while a break above 158.50 could pave the way for further upside.


Final Words About USD vs JPY
The USD/JPY daily analysis shows the pair remains a battleground for traders, influenced by diverging monetary policies and economic data from the US and Japan. With US inflation data and Fed commentary shaping USD sentiment, any surprises could drive sharp movements. On the other hand, the JPY's trajectory will depend on market perception of the Bank of Japan’s ability to manage inflation while supporting growth. The pair’s technical outlook shows signs of bullish momentum, but overbought conditions suggest a potential pullback. Traders should remain vigilant, tracking support and resistance levels and keeping an eye on global economic developments. In this volatile environment, risk management is key to navigating USDJPY’s price action effectively.


01.15.2025
 
GOLD Trading Insights and Key Levels Today


Introduction to GOLD/USD

The GOLD/USD pair, often referred to simply as "Gold" or "XAUUSD," represents the value of one ounce of gold in US dollars. It is a critical benchmark for precious metal trading and is influenced by a variety of global economic, political, and financial factors. Traders and investors use XAU/USD to hedge against inflation, currency volatility, and economic uncertainties, making it one of the most actively monitored instruments.


GOLDUSD Market Overview
The Gold continues to trend upward in the face of heightened global uncertainty and mixed US economic data. Today’s focus is on the US Retail Sales data, which is expected to provide a clear indication of consumer spending trends, potentially impacting the USD. With the Federal Reserve's recent hawkish signals and upcoming comments from New York Fed President John Williams, the USD's strength might see fluctuations, impacting gold's price. As the dollar stabilizes, gold has maintained its bullish momentum, benefiting from its safe-haven appeal. The global economic outlook, influenced by inflation trends and US labor market data, remains critical for GOLD/USD's trajectory.
GOLDUSD_XAUUSD_01_16_2025_Daily_D1_Technical,_Price_action,_and.jpg
GOLD USD Technical Analysis
The daily chart of GOLD USD shows a bullish trend as the price trades in the upper half of the Bollinger Bands, frequently touching the upper band, signaling strong upward momentum. The price is attempting to break above the 0.236 Fibonacci retracement level at $2,678.62, a critical resistance zone. The Relative Strength Index (RSI) at 59.25 indicates moderate bullish strength, while the Williams %R oscillator suggests that the price is nearing overbought territory. A potential breakout above the current Fibonacci resistance could propel the price toward $2,700, while support remains near the Bollinger Band median at $2,642.64.


Final Words about GOLD vs USD
In conclusion, GOLD-USD is poised for further bullish movement, provided it breaks above the $2,678 resistance. Traders should watch for the US Retail Sales and Jobless Claims data as they will likely influence the USD and indirectly impact gold prices. The combination of technical indicators, including Bollinger Bands and RSI, supports a cautious bullish bias. However, a failure to break key resistance levels could lead to temporary consolidation or retracement. With its safe-haven status intact, gold remains a crucial asset amid global uncertainties.


01.16.2025
 
GBPUSD Technical Analysis: Bearish Momentum Persists


Introduction to GBPUSD

The GBP/USD currency pair, often referred to as "Cable," represents the exchange rate between the British pound sterling and the US dollar. This pair holds historical significance and is one of the most widely traded currency pairs globally. Traders closely monitor this pair to analyze the relative strength of two of the world’s leading economies, the UK and the US, making it a critical tool for both short-term and long-term trading strategies.


GBP/USD Market Overview
The GBPUSD pair remains under pressure within a strong downward trend channel. The latest market news has emphasized economic and political developments on both sides. On the US side, the latest jobless claims data revealed a decline in unemployment filings, signaling robust labor market conditions, which are supportive of the US dollar. In addition, comments expected during the ongoing World Economic Forum from US officials could introduce further volatility. On the UK side, the Confederation of British Industry’s (CBI) survey showed modest optimism, although broader economic challenges persist due to weaker manufacturing output expectations. The divergence between these two economies has kept Cable in a bearish mode, with the pair struggling to gain upside momentum. Looking ahead, traders will also watch for key US crude oil inventory reports, which may indirectly impact broader market sentiment.
GBPUSD_UNITEDPIPS_DAILY_1D_Analysis_and_Price_Action_on_01_23_2025.jpg
GBP USD Technical Analysis
On the daily timeframe, GBP/USD is entrenched in a descending trend channel, consistently making lower highs and lower lows. The GBP USD price has rebounded from the lower Bollinger Band and is now trading near the middle band, which coincides with the 0.786 Fibonacci retracement level. This level also aligns with the key %R Fibonacci level, suggesting a strong area of confluence. However, the Bollinger Bands indicate that volatility remains subdued, and the Cable’s inability to break the middle band suggests a lack of bullish conviction. Resistance is evident around 1.2359, while key support sits near the psychological level of 1.2106. Momentum indicators, such as the Williams %R, are still in oversold territory but show signs of potential upward correction. Traders should watch for a breakout from the channel for clearer direction.


Final Words on GBP vs USD
The GBP-USD pair continues to reflect the contrasting economic landscapes of the UK and US. While the recent upward correction suggests potential recovery, the overall trend remains bearish. The GBP USD pair must overcome strong resistance at the 0.786 Fibonacci retracement level to shift market sentiment. US economic data, such as crude oil inventories and upcoming jobless claims, could reinforce the dollar’s strength. Meanwhile, the UK’s economic outlook, highlighted by manufacturing struggles, provides limited support for sterling. Traders are advised to monitor global developments, especially central bank commentary at the World Economic Forum, as they could trigger significant price volatility in the short term.


01.23.2025
 
EURUSD Technical Indicators Signal Bearish Continuation


Introduction to EUR/USD
The EUR/USD pair, also known as "Fiber," is one of the most traded currency pairs in the forex market, representing the exchange rate between the Euro and the US Dollar. As two of the world's most influential currencies, their pairing reflects the strength of the Eurozone's economy versus the United States. Traders and investors closely follow EUR/USD for its liquidity and responsiveness to geopolitical and economic developments.


EURUSD Market Overview
The EURUSD pair continues to reflect global economic conditions, showing bearish tendencies amid recent events. Today, traders are eyeing insights from the World Economic Forum in Davos, where discussions on global economic recovery may bring volatility to the markets. Upcoming releases from S&P Global's PMI reports for both the manufacturing and services sectors will further clarify the strength of the economies on either side of the Atlantic. Additionally, ECB President Christine Lagarde is expected to speak later this week, with her comments likely to influence sentiment around the Euro. With the US PMI data also looming, traders anticipate significant swings as the EUR-USD pair struggles to find directional momentum in this high-impact news environment.


EUR USD Technical Analysis
The EUR USD daily chart reveals the pair's ongoing struggle to break above key resistance levels amid a long-standing bearish trend. Price action shows a rejection near the 0.786 Fibonacci retracement level, reflecting strong selling pressure. Recent bearish candlesticks suggest difficulty in reversing the downward trend. The Alligator indicator reveals a bearish alignment, with the blue jawline at the top, the red teeth in the middle, and the green lips below. However, the green lips are attempting to cross upward, indicating potential consolidation or a corrective move. MACD and its histogram remain bearish, with the lines trending below the zero level, while the Williams %R indicates oversold conditions but has not yet confirmed a reversal. These indicators collectively point toward continued bearish pressure with possible short-term retracements.


Final Words on EUR vs USD
The EUR-USD pair remains under bearish influence, with global economic uncertainties and central bank decisions driving market sentiment. Traders should closely monitor upcoming PMI releases and Christine Lagarde's remarks for potential catalysts. While the technical setup suggests further downward pressure, oversold signals could result in short-term rebounds. Risk management remains essential, as EURUSD is highly sensitive to fundamental developments. Patience is key as the market awaits clearer direction in the coming days.


01.24.2025
 
USD/CAD Daily Technical and Fundamental Analysis


Introduction to USD/CAD
The USD/CAD pair, also known as the "Loonie," represents the exchange rate between the US Dollar (USD) and the Canadian Dollar (CAD). This currency pair is highly influenced by oil prices, economic policies, and trade relationships between the United States and Canada. As one of the most liquid pairs in the forex market, USDCAD offers ample opportunities for traders, especially during high-impact economic events. Today’s trading action is closely tied to developments from the Bank of Canada (BoC) and key US economic data.


USDCAD Market Overview
The USD/CAD pair is in focus as traders brace for significant events influencing both currencies. The Bank of Canada is expected to announce its monetary policy decision today, with the overnight rate anticipated to remain unchanged at 3.00%. Alongside the rate decision, the BoC Monetary Policy Report and subsequent press conference will provide key insights into the central bank's outlook on inflation and economic growth. Meanwhile, the US is set to release Durable Goods Orders, Consumer Confidence data, and the Richmond Manufacturing Index. These releases could provide critical clues about the health of the US economy.
The pair recently experienced bullish momentum, fueled by strong US economic data and weaker oil prices, which often weigh on the CAD. However, with the BoC's decision and US releases on tap, volatility is expected to remain elevated in the near term. Tomorrow's data flow and potential developments in crude oil prices will also play a significant role in determining the pair's direction.


USD CAD Technical Analysis
The USD/CAD daily chart shows that the pair has been in a bullish phase but is beginning to lose strength. Price action remains above the Ichimoku cloud, signaling that the bulls are still in control, but the momentum is weakening. The MACD indicator is showing signs of a potential bearish wave, with the histogram declining and the MACD line approaching the signal line for a possible crossover. Key resistance levels are located at 1.3450, 1.3500, and 1.3550, where recent price action has stalled. On the downside, immediate support levels are seen at 1.3375, 1.3320, and 1.3280, which align with previous consolidation zones. The weakening bullish momentum, combined with bearish signals from the MACD, suggests a potential correction phase for USD/CAD. Traders should watch for a break below support levels to confirm a shift in trend.


Final Words on USD vs CAD
The USD/CAD pair is at a pivotal moment, with significant events on both sides of the border influencing price action. While recent bullish momentum has dominated the pair, weakening technical indicators and looming central bank decisions point to increased volatility. Traders should monitor the Bank of Canada's rate statement and press conference for guidance on CAD movement, as well as US economic releases for insight into USD strength.

Although the pair remains above key support levels, the potential for a bearish correction is growing, especially if the BoC takes a more hawkish tone or if US data disappoints. Risk management is crucial, as USD CAD is likely to experience sharp moves during these high-impact events. Keeping an eye on oil prices, which are closely correlated with the CAD, will also provide additional context for trading decisions.


01.28.2025
 
Gold Price Struggles at ATH – XAU/USD Analysis


Introduction to XAU-USD

Gold (XAU/USD), often referred to as the "safe-haven asset," is one of the most traded commodities in the financial markets. The pair represents the value of gold quoted in US dollars and is influenced by economic data, geopolitical risks, and inflation expectations. Traders and investors monitor XAU/USD closely as it serves as a hedge against market volatility and currency devaluation.


XAU/USD Market Overview
XAU/USD has recently tested its all-time high resistance but is showing signs of hesitation in breaking through decisively. The latest economic updates, including the OPEC meeting, PMI data, and US construction spending, have contributed to market uncertainty. The upcoming Federal Reserve speeches, particularly from Raphael Bostic, could provide further insights into the central bank's stance on interest rates, impacting gold prices. From a macroeconomic perspective, gold remains supported by inflationary concerns and economic uncertainties, but the strength of the US dollar, backed by relatively strong economic data, is creating resistance at higher levels. The PMI and ISM reports indicate continued economic expansion, which could limit gold’s upside potential in the short term. Traders are closely watching upcoming releases, especially the Fed’s monetary policy outlook, which could determine the next big move for XAU/USD.
Goldusd-1D-analysis-Fundamantal-Technical.jpg
XAU USD Technical Analysis

On the daily timeframe, gold is attempting to break above a key resistance level but is facing rejection, as indicated by a bearish engulfing candle forming after a pinbar at the top. This suggests a possible correction before another attempt to break higher. The RSI is displaying bearish divergence, as previous price peaks are not matched by equal momentum, hinting at potential exhaustion in the bullish trend. Furthermore, the MACD histogram shows weakening momentum, and a potential bearish crossover could signal an upcoming retracement. If gold fails to sustain above 2785, we could see a pullback toward the nearest support level at 2718, a crucial level that has historically provided strong demand. A break below this support could further extend losses toward 2650. Conversely, a successful breakout above 2785 could open doors for a continuation toward 2800 and beyond.


Final Words on XAU Vs USD
Gold (XAU/USD) remains in a critical phase, balancing between bullish sentiment driven by global economic concerns and bearish pressure from a strengthening US dollar. Traders should monitor key resistance and support levels, with 2785 acting as a major resistance and 2718 as a potential correction target. Upcoming fundamental events, including Fed speeches and PMI reports, could provide catalysts for further price movements. If economic conditions continue to favor the US dollar, gold may struggle to maintain its recent gains, making risk management crucial in trading this pair.


02.03.2025
 
USD/CAD Daily Forecast: Range-Bound with Breakout Potential


Introduction to USD/CAD

The USD-CAD currency pair, often referred to as the "Loonie," represents the exchange rate between the US Dollar (USD) and the Canadian Dollar (CAD). This forex pair is heavily influenced by economic data, monetary policies from both the Federal Reserve (Fed) and the Bank of Canada (BoC), as well as global oil prices due to Canada's reliance on crude oil exports. Traders and investors closely watch USD/CAD for insights into North American economic trends and risk sentiment.


USD Vs. CAD Market Overview
The USD/CAD pair has been consolidating within a defined price range, facing resistance at the upper boundary and support near its lower limit. Recent volatility in the pair has been driven by expectations surrounding the Federal Reserve's monetary policy, as multiple Fed officials, including Philip Jefferson and Thomas Barkin, are scheduled to speak about the economic outlook. These speeches could provide hints on future interest rate decisions, directly impacting USD strength. Additionally, US economic indicators, such as the ISM Non-Manufacturing PMI and Trade Balance data, are set to be released, which may further drive USD movements. On the CAD side, the market is closely watching Canada’s international trade data, as well as crude oil inventory changes, which have a strong correlation with the Canadian Dollar. Given the uncertainty around Fed policy shifts and economic data releases, USD/CAD remains in a range-bound phase with potential breakout opportunities.
USDCAD-1 D-Daily-Anlaysis-market prediction - 02.05.2025.jpg
USD CAD Technical Analysis

USD/CAD has been trading inside a horizontal channel, struggling to break above the upper boundary. A failed breakout attempt was observed, with long upper wicks on recent candlesticks, suggesting that higher prices lack stability and strong buying momentum. This indicates that selling pressure is increasing at higher levels. If the price breaks out from the top, it could confirm a classic bull flag pattern, potentially sending the pair higher. However, if the price fails to sustain above resistance, it could retrace down to Zone 1 (around 1.4100) and potentially Zone 2 (near 1.3840) if bearish momentum strengthens. The Relative Strength Index (RSI) also indicates bearish divergence, where price made higher highs while RSI made lower highs, signaling a potential reversal or weakening bullish momentum. Traders should closely monitor breakout levels and key support zones for confirmation.


Final Words on USD vs CAD
The USD/CAD pair remains at a pivotal point, with traders awaiting fundamental catalysts from US economic data and Fed speeches. If the Fed maintains a hawkish stance, it could support USD strength and push the pair higher. However, if risk sentiment improves or oil prices rise, CAD could gain momentum, leading to a bearish correction in USD/CAD. For short-term traders, monitoring breakout levels within the channel is crucial, while longer-term traders should focus on macroeconomic trends and oil price movements. If the pair breaks below support, a move towards 1.4100 or lower may be in play. On the upside, a breakout above recent highs could trigger a bullish continuation.


02.05.2025
 

Create an account or login to comment

You must be a member in order to leave a comment

Create account

Create an account on our community. It's easy!

Log in

Already have an account? Log in here.

Similar threads

Users Who Are Viewing This Thread (Total: 1, Members: 0, Guests: 1)

Top
AdBlock Detected

We get it, advertisements are annoying!

Sure, ad-blocking software does a great job at blocking ads, but it also blocks useful features of our website. For the best site experience please disable your AdBlocker.

I've Disabled AdBlock    No Thanks