What's new

Forex News Daily Analysis By FXGlory

4.70 star(s) 3 Votes
EURUSD H4 Technical and Fundamental Analysis for 03.13.2025


Time Zone: GMT +2
Time Frame: 4 Hours (H4)


Fundamental Analysis

The EURUSD currency pair may see increased volatility today due to Eurozone data (Unemployment, Industrial Production) and a panel discussion featuring Bundesbank President Joachim Nagel, which could bolster or weigh on the EUR. Meanwhile, the USD faces multiple releases (Core PPI, PPI, Jobless Claims, Natural Gas Storage, and a 30-year Treasury Auction), offering insights into inflation and labor conditions. These events collectively shape the near-term outlook for EURUSD H4, highlighting the importance of both fundamental chart daily analysis and price action for traders.


Price Action
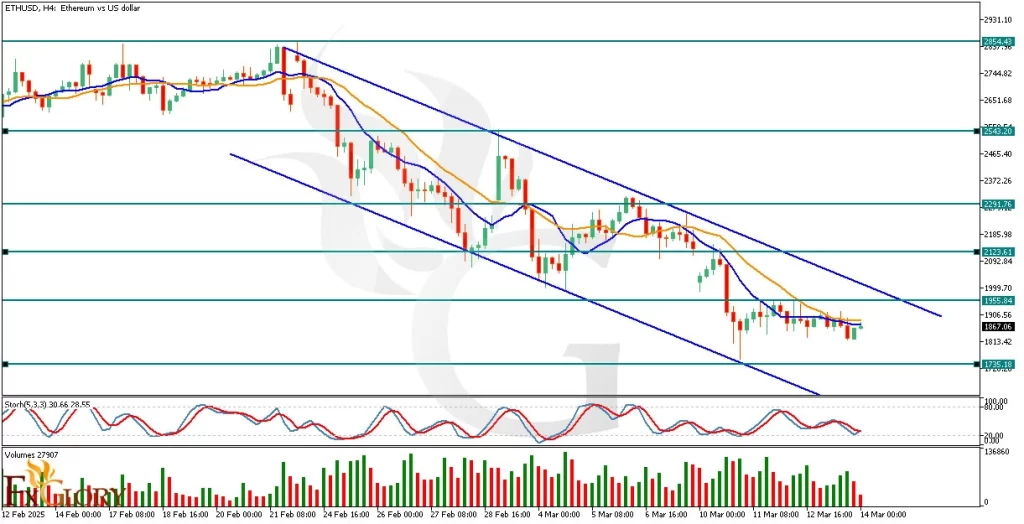
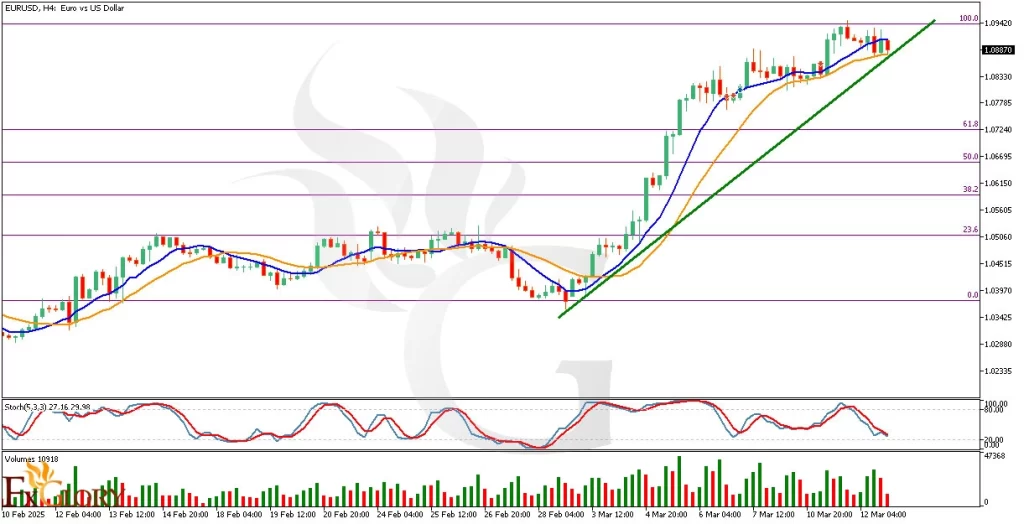
EURUSD has been in a clear bullish trend since early March, with higher highs and higher lows supported by an ascending trendline. Despite minor consolidation in recent candles, the overall momentum remains positive. Pullbacks toward the trendline may present buying opportunities, as long as price action holds above key support levels.


Key Technical Indicators
Moving Averages (MA 9 and MA 17):
The 9-period short MA has crossed above the 17-period long MA, confirming bullish momentum. The long MA sits below recent candles, and the short MA is close to price action, suggesting ongoing upside strength.
Stochastic Indicator: The Stochastic is near overbought territory, hinting at a possible short-term pullback. If it crosses below mid-levels, a deeper correction could emerge, but the broader trend remains bullish as long as it stays above 50.
Volume: Volume has aligned with the recent upward movement, indicating strong buying interest. Slight dips during consolidations are normal, but overall volume supports the bullish trend, especially on rallies.


Support and Resistance
Support:
Immediate support is located at 1.0980, which aligns with the ascending trendline.
Resistance: The nearest resistance level is at 1.1060, which coincides with a recent swing high.


Conclusion and Consideration
The EURUSD H4 chart shows persistent bullish momentum, underpinned by favorable fundamentals and positive technical indicators. While short-term pullbacks may occur—especially if the Stochastic continues to retreat—price action remains constructive above the rising trendline. Traders should keep an eye on today’s Eurozone and US releases for potential market-moving surprises, particularly regarding inflation and labor-market data.


Disclaimer: The analysis provided for EUR/USD is for informational purposes only and does not constitute investment advice. Traders are encouraged to perform their own analysis and research before making any trading decisions on EURUSD. Market conditions can change quickly, so staying informed with the latest data is essential.


FXGlory
03.13.2025
 
ETHUSD H4 Technical and Fundamental Analysis for 03.14.2025


Time Zone: GMT +2
Time Frame: 4 Hours (H4)


Fundamental Analysis:

Ethereum (ETHUSD) remains a major player in the cryptocurrency market, widely used for decentralized applications and smart contracts. Today, ETH/USD's price action will be significantly influenced by the University of Michigan Consumer Sentiment and Inflation Expectations reports from the U.S. These economic indicators can impact the strength of the U.S. dollar (USD), which historically shares an inverse correlation with Ethereum and other cryptocurrencies. If consumer confidence is stronger than expected, it may lead to USD strength, applying bearish pressure on ETHUSD. Conversely, weak consumer sentiment and inflation concerns could support Ethereum’s price, as traders seek alternatives to fiat currencies. With ongoing regulatory discussions in the U.S. and potential institutional adoption of Ethereum-based applications, ETHUSD traders should monitor both macroeconomic data and blockchain-related developments.


Price Action:
The ETHUSD H4 chart reveals a clear bearish trend within a descending channel, with price action consistently forming lower highs and lower lows. The cryptocurrency is struggling to gain bullish momentum, facing resistance at key levels while respecting the downward-sloping trendline. Despite temporary consolidation, Ethereum remains below both short- and long-term moving averages, reinforcing the prevailing bearish sentiment. If ETHUSD fails to break above resistance levels, further downside pressure may lead to another leg lower toward the next support zone. However, a breakout above the descending channel could signal a potential trend reversal.


Key Technical Indicators:
Moving Averages (MA):
The price remains below the 9-period short MA (blue) and the 17-period long MA (orange), confirming a strong bearish momentum. The downward crossover of the shorter MA below the longer MA suggests continued selling pressure, making bullish recoveries less likely unless a decisive break above the moving averages occurs.
Stochastic Oscillator: The stochastic (5,3,3) is currently at 30.66, indicating that ETHUSD is approaching oversold territory but has not yet fully bottomed out. If the stochastic moves below 20, a short-term bounce may occur; however, sustained bearish momentum suggests further weakness unless a reversal signal emerges.
Volume: The volume bars show increased selling pressure, especially during major downward price movements. There has been no significant spike in buying volume, meaning the bears remain in control. If volume increases on bullish candles, it may indicate a potential accumulation phase before a breakout.


Support and Resistance Levels:
Support:
The nearest support level is $1,735, which aligns with previous lows and a key psychological barrier. A break below this level could lead to further declines.
Resistance: The first major resistance level is at $1,955, near the upper boundary of the descending channel. A breakout above this level could invalidate the bearish trend and shift momentum towards the bulls.


Conclusion and Consideration:
The ETHUSD H4 analysis confirms a strong bearish trend, with price action respecting a downward channel and key indicators pointing toward continued weakness. The moving averages, stochastic, and volume all support the bearish outlook unless a major resistance breakout occurs. Traders should monitor today’s U.S. economic data, as stronger-than-expected results may push the USD higher, further pressuring ETHUSD. A potential break above $1,955 could signal a trend shift, but failure to hold support at $1,735 may trigger further declines. Given the volatile nature of cryptocurrencies, traders should apply proper risk management strategies and remain aware of global economic and regulatory developments.


Disclaimer: The analysis provided for ETH/USD is for informational purposes only and does not constitute investment advice. Traders are encouraged to perform their own analysis and research before making any trading decisions on ETHUSD. Market conditions can change quickly, so staying informed with the latest data is essential.


FXGlory
03.14.2025
 
NZDUSD Daily Technical and Fundamental Analysis for 03.18.2025


NZDUSD-H4-chart outlook and price prediction for 03.18.2025 .png

Time Zone: GMT +2
Time Frame: 4 Hours (H4)


Fundamental Analysis

The NZD/USD currency pair represents the exchange rate between the New Zealand Dollar (NZD) and the US Dollar (USD). Today, NZD may experience volatility due to the upcoming Global Dairy Trade (GDT) data release, a significant indicator of New Zealand’s economic health, as higher dairy product prices typically strengthen the NZD. The US Dollar could also see significant movement today with the release of key economic data, including Residential Building Permits, Housing Starts, Import Prices, Capacity Utilization Rate, and Industrial Production. Positive outcomes in these indicators usually support the USD, adding bearish pressure on the NZDUSD pair.


Price Action
The NZD-USD pair analysis on the H4 timeframe demonstrates a strong bullish breakout above the previous resistance zone, now converted into support. Currently, the price has reached the Fibonacci expansion level of 100.0, indicating a high probability of a corrective pullback. Initially, the price is expected to retrace toward the ascending support trendline, followed by a potential deeper correction toward the horizontal support zone.


Key Technical Indicators
RSI (Relative Strength Index):
The RSI indicator currently reads 75.73, indicating an overbought scenario. This suggests a probable price correction in the short term to ease the overbought condition.
MACD (Moving Average Convergence Divergence): The MACD histogram remains bullish, although diminishing momentum indicates potential weakening buying pressure. Traders should be alert for a bearish crossover that could signal a reversal or pullback.
Stochastic Oscillator: The Stochastic Oscillator shows a strongly overbought condition at levels 92.19 and 94.34, emphasizing the likelihood of an imminent short-term correction.


Support and Resistance
Support:
Immediate support is located at the ascending trendline near 0.5770, followed by a key horizontal support zone around 0.5730-0.5725.
Resistance: The nearest resistance level is at the recent peak near 0.5822, coinciding with the Fibonacci Expansion 100.0 level. Further resistance can be observed at the psychological mark of 0.5850.


Conclusion and Consideration
The NZD/USD pair forecast on the H4 chart suggests continued bullish momentum, supported by current price action and technical indicators. However, the overbought conditions indicated by RSI and Stochastic suggest the pair is likely to see a corrective move soon. Traders should monitor upcoming economic news closely, especially GDT and US economic indicators, which could significantly impact the NZD-USD exchange rate.


Disclaimer: The analysis provided for NZD/USD is for informational purposes only and does not constitute investment advice. Traders are encouraged to perform their own analysis and research before making any trading decisions on NZDUSD. Market conditions can change quickly, so staying informed with the latest data is essential.


FXGlory
03.18.2025
 
USDJPY Technical and Fundamental Analysis for 03.19.2025


USDJPY-H4-chart outlook and price prediction for 03.19.2025.png

Time Zone: GMT +2
Time Frame: 4 Hours (H4)


Fundamental Analysis

The USDJPY currency pair remains sensitive today with important economic indicators scheduled. For JPY, upcoming releases include Japan's Machine Orders, Adjusted Merchandise Trade Balance, and Industrial Production, all crucial leading indicators of economic activity and currency strength. The Bank of Japan's monetary policy outlook and recent interest rate statements also continue to influence JPY. Conversely, for the USD, traders will closely watch the EIA Crude Oil Inventories, a key measure influencing the US Dollar through energy market sentiment. These fundamental releases could significantly impact USDJPY volatility.


Price Action
USDJPY price action analysis in the H4 timeframe reveals a confirmed bullish reversal. After breaking the downtrend line, price has entered an ascending channel, currently testing the lower boundary and coinciding with EMA support zones. Recent candles suggest bullish sentiment may continue, targeting the upper boundary of the ascending channel, reinforcing the bullish outlook.


Key Technical Indicators
Parabolic SAR:
The Parabolic SAR dots are positioned below recent candles, indicating bullish momentum and a positive trend continuation signal for USDJPY.
EMA (Exponential Moving Average): Price remains above both the short-term and medium-term EMA lines, highlighting bullish support that can propel USDJPY higher.
RSI (Relative Strength Index): Currently at 58.58, RSI remains comfortably within neutral territory, suggesting sufficient room for further bullish movement without immediate risk of overbought conditions.
MACD (Moving Average Convergence Divergence): MACD is above the signal line, maintaining positive values, indicative of sustained bullish momentum, although recent histogram bars are shorter, signaling slightly decreased buying momentum.
Stochastic Oscillator: The stochastic oscillator has recently approached the oversold region and is now curving upwards, providing a bullish crossover that indicates renewed buying interest could lift prices further.


Support and Resistance:
Support:
Immediate support lies at the lower boundary of the ascending channel at approximately 148.900, strengthened by EMA convergence.
Resistance: Key resistance is observed near the upper boundary of the ascending channel at approximately 149.900, marking recent price highs.


Conclusion and Consideration:
The current H4 analysis for USDJPY indicates bullish momentum supported by key technical indicators such as Parabolic SAR, EMA, RSI, MACD, and Stochastic oscillator. The ascending channel supports further bullish sentiment. Traders must remain cautious and monitor upcoming fundamental economic data releases closely, which can significantly affect the USDJPY exchange rate, leading to potential volatility.


Disclaimer: The analysis provided for USD/JPY is for informational purposes only and does not constitute investment advice. Traders are encouraged to perform their own analysis and research before making any trading decisions on USDJPY. Market conditions can change quickly, so staying informed with the latest data is essential.


FXGlory
03.19.2025
 
EURUSD Daily Technical and Fundamental Analysis for 03.24.2025


EURUSD-H4-chart-outlook-and-price-prediction-for-03.24.2025.png

Time Zone: GMT +2
Time Frame: 4 Hours (H4)


Fundamental Analysis:

The EUR/USD currency pair today will likely be influenced significantly by flash PMI reports for both the Eurozone and the US, released by S&P Global. Purchasing Managers' Index (PMI) data, crucial for gauging economic health, could trigger volatility if actual figures diverge from market forecasts. Additionally, traders should watch speeches by Federal Reserve Bank of Atlanta President Raphael Bostic and Federal Reserve Governor Michael Barr, whose statements could provide insights on future monetary policy and impact the USD.


Price Action:
EURUSD price action analysis in the H4 timeframe indicates the price has reached a critical support level and has reacted to it positively. Several pin bar candles have formed near the support, indicating indecision and imminent volatility. A move upward towards the middle Bollinger Band, acting as the first target, followed by the upper Bollinger Band, could be expected as traders anticipate a price correction from this support level.


Key Technical Indicators:
Bollinger Bands:
EURUSD’s Bollinger Bands show that the price is currently at the lower band, signaling a potential reversal upward. With the middle Bollinger Band serving as an initial target (around 1.0850), a sustained move above this level could lead towards the upper band, near 1.0900.
RSI (Relative Strength Index): The RSI indicator stands at approximately 38.66, slightly above the oversold threshold (30). This indicates bearish exhaustion and potential for bullish recovery. However, traders should look for confirmation from additional bullish candles before initiating buy positions.
MACD (Moving Average Convergence Divergence): MACD histogram bars are below the zero line but decreasing in magnitude, showing waning bearish momentum. The MACD lines are converging, suggesting a bullish crossover might occur soon, further reinforcing a potential bullish reversal.
Williams %R: Currently at -80.86, this indicator reflects oversold conditions, implying that selling pressure may diminish, giving way to an upward price reversal or retracement soon. Traders should look out for an upward movement in the indicator as confirmation.


Support and Resistance:
Support:
Immediate key support is observed at 1.0813, where recent price actions formed significant pin bar candles indicating buying pressure.
Resistance: Initial resistance is identified at the middle Bollinger Band around 1.0850, followed by a stronger resistance at the upper Bollinger Band, around the 1.0900 psychological level.


Conclusion and Consideration:
EURUSD’s technical outlook on the H4 timeframe suggests a potential bullish reversal, supported by oversold conditions in the RSI and %R, and a reduction in bearish momentum on the MACD. Price action at the support level combined with today's significant PMI reports and speeches by Fed officials could induce volatility. Traders should manage positions carefully, considering the fundamental news events today, which may substantially influence EURUSD price movements.


Disclaimer: The analysis provided for EUR/USD is for informational purposes only and does not constitute investment advice. Traders are encouraged to perform their own analysis and research before making any trading decisions on EURUSD. Market conditions can change quickly, so staying informed with the latest data is essential.


FXGlory
03.24.2025
 
BTCUSD Daily Technical and Fundamental Analysis for 03.25.2025


Time Zone: GMT +2
Time Frame: 4 Hours (H4)


Fundamental Analysis:

The BTC-USD pair is primarily driven by ongoing developments in regulatory landscapes and macroeconomic conditions. Today, traders will closely monitor remarks by Federal Reserve Governor Adriana Kugler and New York Fed President John Williams. Hawkish statements could strengthen the USD, potentially impacting BTCUSD negatively. Additionally, data on the US housing market, including the S&P Corelogic CS Indices and the House Price Index (HPI), may cause volatility, reflecting investor sentiment towards the USD and subsequently influencing Bitcoin's price action.


Price Action:
The BTC/USD H4 chart indicates a significant bullish breakout from its previous downtrend, marked clearly by crossing above the downward trendline (red). Currently, the price action has encountered resistance at the upper boundary of an ascending channel, highlighting a potential retracement scenario. The most recent candle, a bearish signal, further supports the probability of a short-term corrective move towards the lower boundary of the ascending channel before resuming the upward momentum.


Key Technical Indicators:
RSI (Relative Strength Index):
The RSI currently stands at 67.71, nearing the overbought territory of 70. This signals that BTCUSD may experience limited upside potential in the short term, reinforcing expectations of a temporary pullback or consolidation period.
MACD (Moving Average Convergence Divergence): The MACD histogram remains positive, though bars are slightly shortening, indicating a potential weakening in bullish momentum. Traders should observe the MACD line closely for signs of a bearish crossover, which would confirm a shift towards downward pressure.
Stochastic Oscillator: Currently reading at 87.40, the Stochastic indicator clearly signals an overbought condition. This technical evidence strongly supports the likelihood of a forthcoming corrective move or a temporary bearish reversal before bulls regain control.


Support and Resistance:
Support:
Immediate support lies near $84,200, the lower boundary of the ascending channel, followed by a stronger support around the previous resistance-turned-support at $82,260.
Resistance: Initial resistance is currently observed at $87,870, coinciding with the top boundary of the ascending channel. Breaking above this could target the psychological resistance at $90,000.


Conclusion and Consideration:
BTC-USD on the H4 timeframe remains overall bullish following a breakout from a prior downtrend. However, the current technical indicators strongly suggest a potential short-term correction due to overbought conditions. Traders should exercise caution and closely monitor upcoming fundamental events from the US economic calendar, which might significantly impact short-term volatility. Proper risk management is recommended during these potentially turbulent trading conditions.


Disclaimer: The analysis provided for BTC/USD is for informational purposes only and does not constitute investment advice. Traders are encouraged to perform their own analysis and research before making any trading decisions on BTCUSD. Market conditions can change quickly, so staying informed with the latest data is essential.


FXGlory
03.25.2025
 
GBPUSD Daily Technical and Fundamental Analysis for 03.26.2025


GBPUSDH4-FXGlory.jpg


Time Zone: GMT +2
Time Frame: 4 Hours (H4)


Fundamental Analysis:

The GBPUSD currency pair remains a key focus for traders navigating both UK and US economic shifts. Today, significant UK inflation data was released, with CPI y/y holding steady at 3.0%, while Core CPI came in slightly lower than forecast at 3.6%, suggesting inflationary pressures may be softening. RPI and HPI also declined marginally, which could reduce pressure on the Bank of England to raise rates aggressively. Adding to the volatility, the UK government’s Annual Budget Release is due later today, which may trigger fiscal policy changes impacting GBP sentiment. On the US side, market attention shifts to Core Durable Goods Orders, which came in at 0.2% versus a flat forecast, and Durable Goods Orders dropped by -1.1%, under expectations. Meanwhile, upcoming FOMC speeches and Crude Oil Inventories data may introduce short-term fluctuations in USD value. This mixed data outlook underpins a cautious tone in today's GBPUSD H4 fundamental chart analysis.


Price Action:
The GBPUSD H4 chart reveals a textbook price action setup. After a strong bullish impulse that lifted the pair above the 1.30 psychological zone, price corrected and entered a bearish flag channel, showing signs of consolidation and exhaustion. The price has tested the 23.6% Fibonacci retracement level twice but failed to close convincingly below it, highlighting it as a key pivot zone. Now, GBPUSD is attempting a third break beneath this level, and a successful move could accelerate downside momentum. The current structure fits within a bearish continuation pattern following an impulsive move up—often a signal that more downside correction is likely in the short term.


Key Technical Indicators:
MACD (12,26,9): The MACD histogram is marginally below the zero line, and both MACD and signal lines are in bearish alignment. This setup suggests bearish momentum may soon gain traction if the MACD begins widening negatively.
RSI (14): The RSI is currently hovering around the neutral zone (50.34), slightly tilted downward, reflecting weakening bullish momentum and potential readiness for a deeper bearish wave. If RSI dips below 45, it would confirm increasing selling pressure.


Support and Resistance:
Support:
Key support levels for GBPUSD on the H4 chart include 1.2905 (23.6% Fibonacci), 1.2825 (38.2%), and 1.2750 (50%), marking critical zones for potential bearish continuation.
Resistance: Key resistance levels for GBPUSD are 1.3010 (channel top) and 1.3060 (swing high), both acting as major hurdles for bullish continuation.


Conclusion and Consideration:
In conclusion, the GBPUSD pair, as observed on the H4 chart, is entering a sensitive zone where momentum indicators and price structure suggest potential bearish continuation. The combination of soft UK inflation data and cautious US economic indicators adds weight to this bearish sentiment. The bearish flag pattern, repeated tests of Fibonacci support, and weakening RSI and MACD signals all point to a possible breakdown scenario. However, traders should remain cautious ahead of the UK Annual Budget Release and FOMC member speeches which may cause sharp intraday volatility. This GBPUSD H4 technical and fundamental analysis highlights the importance of monitoring upcoming price action around the 23.6% Fibonacci level as a decision point.


Disclaimer: The analysis provided for GBP/USD is for informational purposes only and does not constitute investment advice. Traders are encouraged to perform their own analysis and research before making any trading decisions on GBPUSD. Market conditions can change quickly, so staying informed with the latest data is essential.


FXGlory
03.26.2025
 
GOLDUSD (XAUUSD) H4 Technical and Fundamental Analysis for 03.27.2025


Time Zone: GMT +2
Time Frame: 4 Hours (H4)


Fundamental Analysis:

GOLD-USD (XAU/USD) is currently experiencing volatility influenced by today's significant economic news releases from the US. Upcoming remarks by US President Donald Trump concerning auto tariffs and the scheduled interview with Newsmax TV may create substantial fluctuations in USD valuation, directly impacting GOLD USD price movements. Additionally, critical economic indicators such as GDP data, Initial Jobless Claims, GDP Price Index, Trade Balance, Wholesale Inventories, Pending Home Sales, and Natural Gas Storage reports will further dictate market sentiment and trading volumes. Traders should remain cautious and monitor these fundamental catalysts closely for potential trading opportunities.


Price Action:
The H4 chart for XAU/USD indicates a corrective scenario, with the price recently breaking below key support lines and now hovering around a crucial horizontal support zone. This level aligns closely with the lower boundary of the Bollinger Bands, suggesting potential for a short-term consolidation or possible reversal. Recent candles display indecision, reflecting market uncertainty as buyers and sellers struggle to establish control. This price action indicates a pivotal moment for GOLD-USD, warranting careful monitoring for confirmation signals.


Key Technical Indicators:
Bollinger Bands:
Bollinger Bands have contracted significantly, indicating low market volatility and signaling an impending breakout. Currently, GOLDUSD price is near the middle Bollinger Band (moving average), suggesting equilibrium between buyers and sellers. Traders should watch closely for a decisive breakout from the bands to determine the next significant market direction.
RSI (Relative Strength Index): The RSI currently shows clear bearish divergence, indicating weakening bullish momentum. At a level of around 49.82, RSI is neutral but the divergence suggests a potential downward corrective movement. This confirms the price action signal of possible further bearish pressure.
Parabolic SAR: The Parabolic SAR dots are positioned above the current price candles, clearly signaling bearish sentiment and suggesting the short-term trend favors sellers. Traders should view this as confirmation of the potential continuation of downward movement unless dots shift below price candles.
MACD (Moving Average Convergence Divergence): MACD histogram bars are decreasing and approaching the zero line, indicating weakening bullish momentum and a potential bearish crossover. If a crossover occurs, this would strengthen the bearish outlook significantly and provide further confirmation for downward price potential.


Support and Resistance Levels:
Support:
Immediate horizontal support is clearly defined around the 3003.55 level, a critical zone aligning with the lower Bollinger Band, providing a strong base for short-term price action.
Resistance: Immediate resistance is identified around the 3035.00 mark, where the upper Bollinger Band and recent trend line converge, representing significant technical hurdles for bullish attempts.


Conclusion and Consideration:
The current technical scenario for XAUUSD on the H4 timeframe strongly indicates caution due to a potential bearish corrective move. Bearish divergence on RSI, Parabolic SAR indications, and weakening MACD histogram all collectively confirm this potential downside risk. However, significant fundamental catalysts from the US today could introduce volatility, altering the current technical setup. Traders are advised to carefully observe the price reaction around key support at 3003.55 and resistance at 3035.00, considering both technical confirmations and fundamental developments.


Disclaimer: The analysis provided for GOLD/USD is for informational purposes only and does not constitute investment advice. Traders are encouraged to perform their own analysis and research before making any trading decisions on GOLDUSD. Market conditions can change quickly, so staying informed with the latest data is essential.


FXGlory
03.27.2025
 

Create an account or login to comment

You must be a member in order to leave a comment

Create account

Create an account on our community. It's easy!

Log in

Already have an account? Log in here.

Similar threads

Users Who Are Viewing This Thread (Total: 2, Members: 0, Guests: 2)

Top
AdBlock Detected

We get it, advertisements are annoying!

Sure, ad-blocking software does a great job at blocking ads, but it also blocks useful features of our website. For the best site experience please disable your AdBlocker.

I've Disabled AdBlock    No Thanks