FXOpen Trader
Active Member
Gold Price Could Extend Gains While Crude Oil Price Corrects Lower

Gold price started a decent recovery wave above the $1,820 resistance. Crude oil price is declining and it might even break the $70.00 support zone.
Important Takeaways for Gold and Oil
Gold Price Technical Analysis
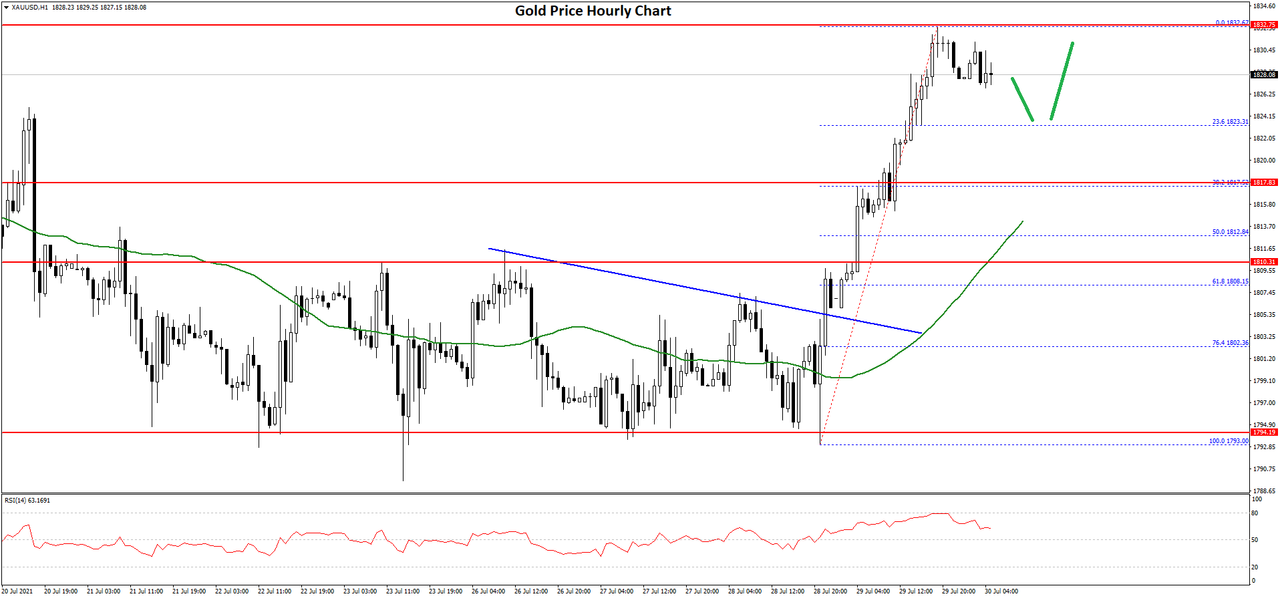
This week, gold price formed a decent support base above the $1,790 zone against the US Dollar. The price started a fresh upward move and it surpassed the $1,800 resistance zone.
The price even settled above the $1,810 level and the 50 hourly simple moving average. The price even broke the $1,820 resistance and it traded as high as $1,833 on FXOpen. Recently, there was a minor downside correction below the $1,830 level.
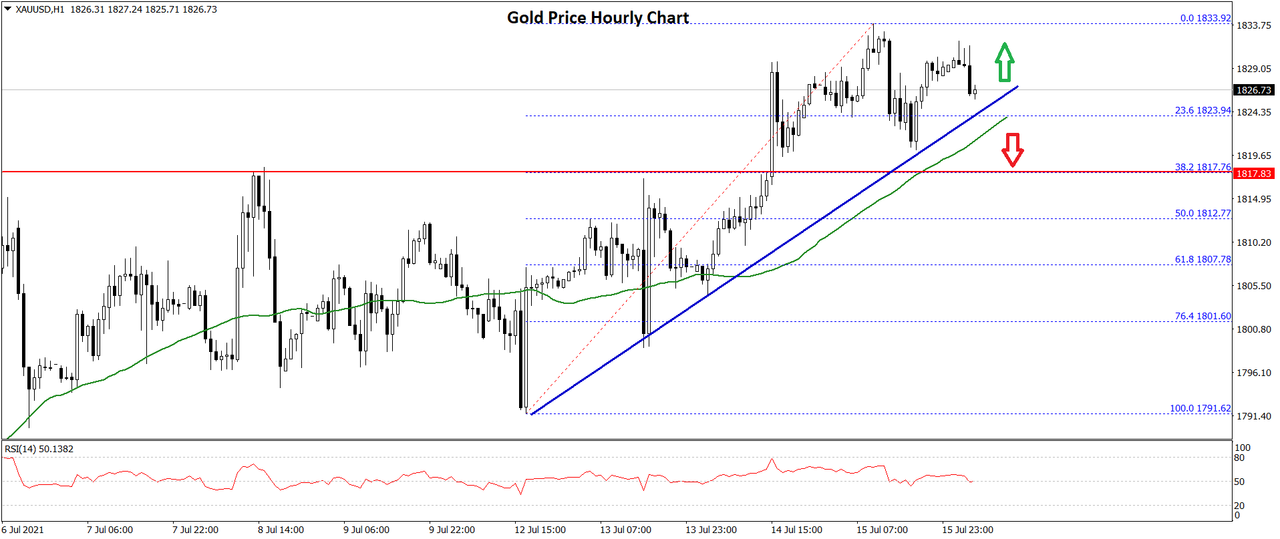
The price even traded below the 23.6% Fib retracement level of the upward move from the $1,791 low to $1,833 high. However, the bulls are protecting the $1,820 support.
There is also a key bullish trend line forming with support near $1,825 on the hourly chart of gold. The 50 hourly SMA is also near the trend line. If there is a downside break, the price could test the $1,810 support.
An intermediate support could be the 50% Fib retracement level of the upward move from the $1,791 low to $1,833 high at $1,812. An immediate resistance on the upside is near the $1,832 level.
The first major resistance is near the $1,835 level. If the price breaks the $1,835 level, it could accelerate higher. In the stated case, the price could rise towards the $1,850 zone.
Read Full on FXOpen Company Blog...

Gold price started a decent recovery wave above the $1,820 resistance. Crude oil price is declining and it might even break the $70.00 support zone.
Important Takeaways for Gold and Oil
- Gold price started a fresh recovery wave after forming a base above $1,790 against the US Dollar.
- There is a key bullish trend line forming with support near $1,825 on the hourly chart of gold.
- Crude oil price failed to settle above $75.000 and it started a fresh decline.
- There was a break below a major bullish trend line with support near $74.55 on the hourly chart of XTI/USD.
Gold Price Technical Analysis
This week, gold price formed a decent support base above the $1,790 zone against the US Dollar. The price started a fresh upward move and it surpassed the $1,800 resistance zone.
The price even settled above the $1,810 level and the 50 hourly simple moving average. The price even broke the $1,820 resistance and it traded as high as $1,833 on FXOpen. Recently, there was a minor downside correction below the $1,830 level.

The price even traded below the 23.6% Fib retracement level of the upward move from the $1,791 low to $1,833 high. However, the bulls are protecting the $1,820 support.
There is also a key bullish trend line forming with support near $1,825 on the hourly chart of gold. The 50 hourly SMA is also near the trend line. If there is a downside break, the price could test the $1,810 support.
An intermediate support could be the 50% Fib retracement level of the upward move from the $1,791 low to $1,833 high at $1,812. An immediate resistance on the upside is near the $1,832 level.
The first major resistance is near the $1,835 level. If the price breaks the $1,835 level, it could accelerate higher. In the stated case, the price could rise towards the $1,850 zone.
Read Full on FXOpen Company Blog...


