What's new

General About FXOpen – FXOpen.com

4.40 star(s) 7 Votes
Gold Breaks Above $1,900 On Inflation Fears


Gold has long played an important role in financial markets. It is the only form of money that survived for millenniums, and investment managers value it as a hedge against inflation.

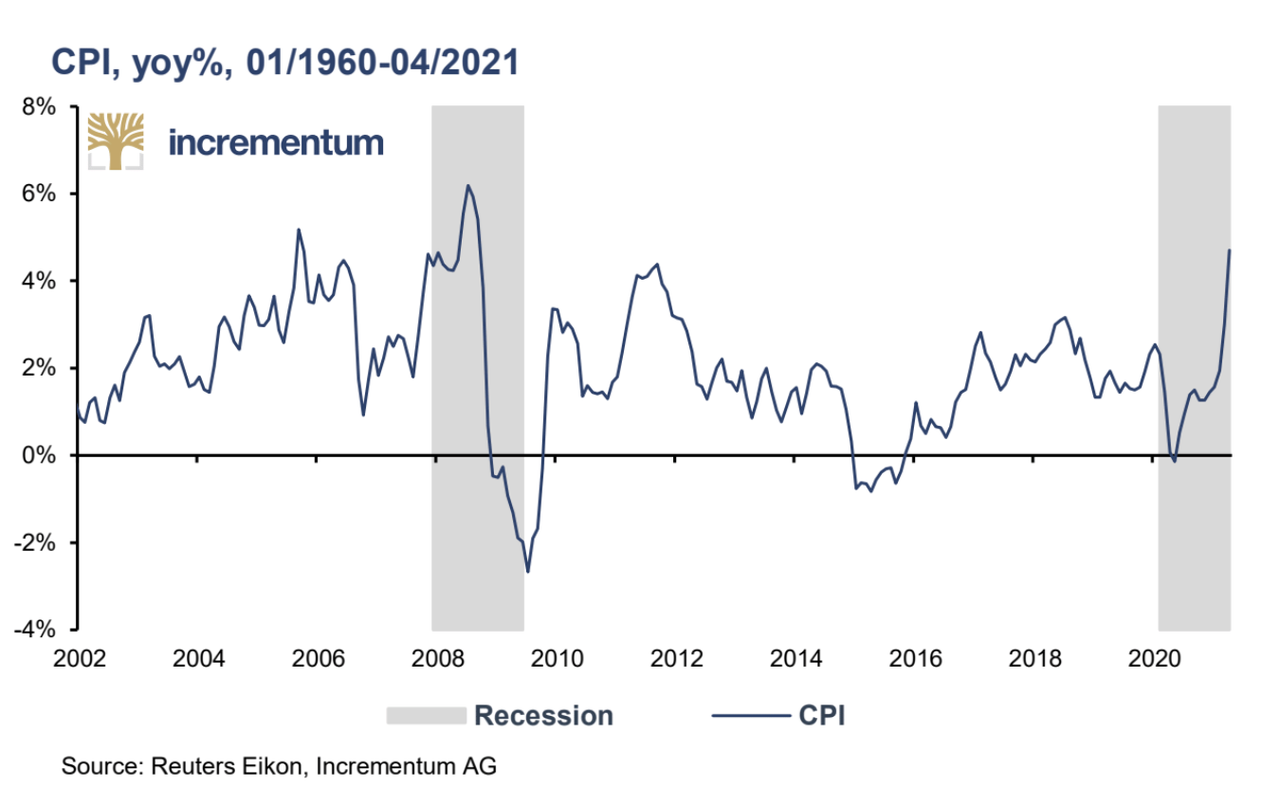
Inflation is on everyone´s lips nowadays. In April, the Consumer Price Index (CPI) in the United States has grown at the fastest pace since 1981. Both the core and the headline CPI are poised to rise further in the summer, as the US government and the Fed keep the accommodative measures.

Last week, the Personal Core Expenditure (PCE) in the United States rose by 0.7% on expectations of 0.6% and following 0.4% in the previous month. The upbeat data is important because the PCE measures the change in the price of goods and services purchased by consumers, without counting for energy and food prices, considered too volatile. Also, the PCE is the Fed´s favored way of measuring inflation, and the rise fuels expectations of higher inflation in the months ahead.


Two Different Recessions

A quick comparison of the two last recessions reveals that the CPI had a different path. For example, in the aftermath of the 2008-2009 Great Financial Crisis, inflation fell below zero. In other words, deflation gripped the world´s developed economies, or at least it threatened to do so.

However, it is not the case during the current recession. Instead of falling, inflation is poised to rise further. The Fed in the United States has anticipated higher inflation already since August last year. During the Jackson Hole symposium in 2020, the Fed changed its mandate from targeting 2% to averaging 2% over a certain period.

Higher inflation typically triggers higher gold prices. Only that the price of gold tumbled since last summer, falling from a record high above $2,000 to below $1,700. At the same time, the US dollar continued to weaken, losing ground against its G10 peers.

But the price of gold recovered from its recent lows and now threatens to break to a new all-time high. If the trend in inflation seen in April is set to continue, the bullish trend in the price of gold is likely to continue as well.

Now that the cryptocurrency market lost more than half of its value, as seen by the price of Bitcoin falling by 50% in a couple of weeks, investors seem to favor gold again as a hedge against inflation. If that is the case, the recent rise in the price of gold is just the start of an attempt at a new all-time high. The higher the CPI rises, the bigger the share investors will allocate to gold.


FXOpen Blog
 
EUR/USD Eyes More Upsides, USD/CHF Could Extend Losses


EUR/USD is trading in a positive zone above the 1.2200 support. USD/CHF is declining and it could extend losses below the 0.8950 support zone.

Important Takeaways for EUR/USD and USD/CHF


  • The Euro started a fresh increase and it broke the 1.2200 resistance zone against the US Dollar.
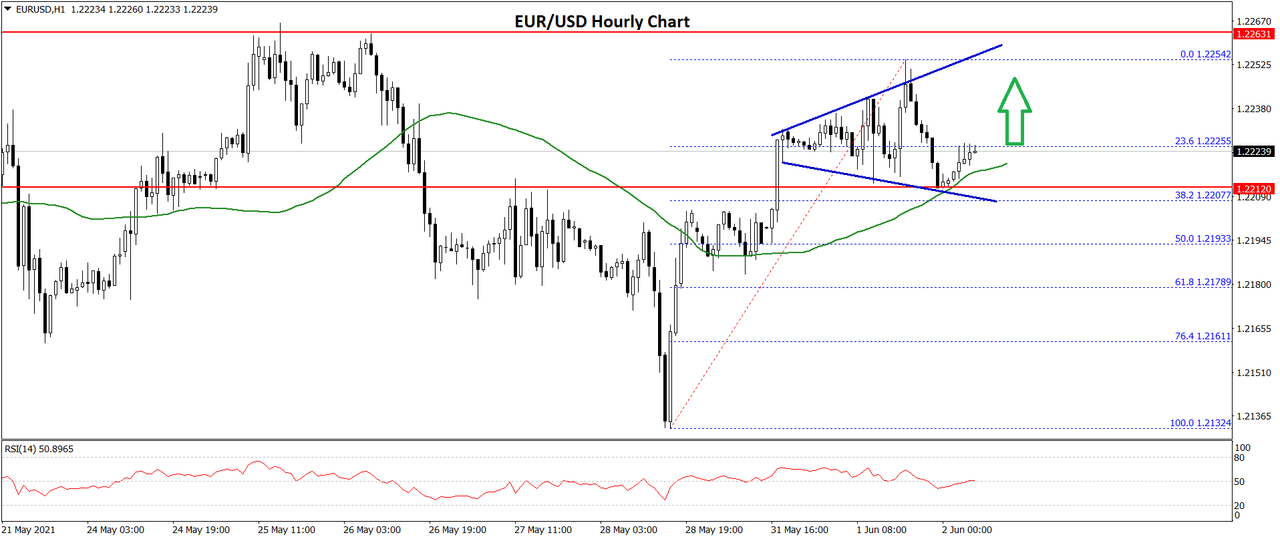
  • There is a key expanding triangle forming with resistance near 1.2255 on the hourly chart of EUR/USD.
  • USD/CHF started a fresh decline after it failed to clear the 0.9020 resistance zone.
  • There was a break below a major bullish trend line with support near 0.8980 on the hourly chart.

EUR/USD Technical Analysis

The Euro formed a strong support base above the 1.2120 level against the US Dollar. As a result, the EUR/USD pair started a fresh increase and it traded above the main 1.2200 resistance zone.

The pair even surged above the 1.2220 level and settled above the 50 hourly simple moving average. A high was formed near 1.2254 on FXOpen and the pair is now correcting gains. It traded below the 1.2220 support level.


There was a break below the 23.6% Fib retracement level of the upward move from the 1.2132 swing low to 1.2254 high. It is now trading nicely above the 1.2200 support zone and the 50 hourly SMA.

There is also a key expanding triangle forming with resistance near 1.2255 on the hourly chart of EUR/USD. On the upside, the pair is facing hurdles near the 1.2240 and 1.2250 levels. A clear upside break above 1.2250 could set the pace for a larger increase.

On the downside, there is a major support forming near the 1.2200 zone. The next key support is near the 1.2190 level. It is near the 50% Fib retracement level of the upward move from the 1.2132 swing low to 1.2254 high.

A downside break below the 1.2190 support could increase selling pressure in the near term. The next major support could be near the 1.2150 level.


Read Full on FXOpen Company Blog...
 
LTC and EOS – Indecision


LTC/USD

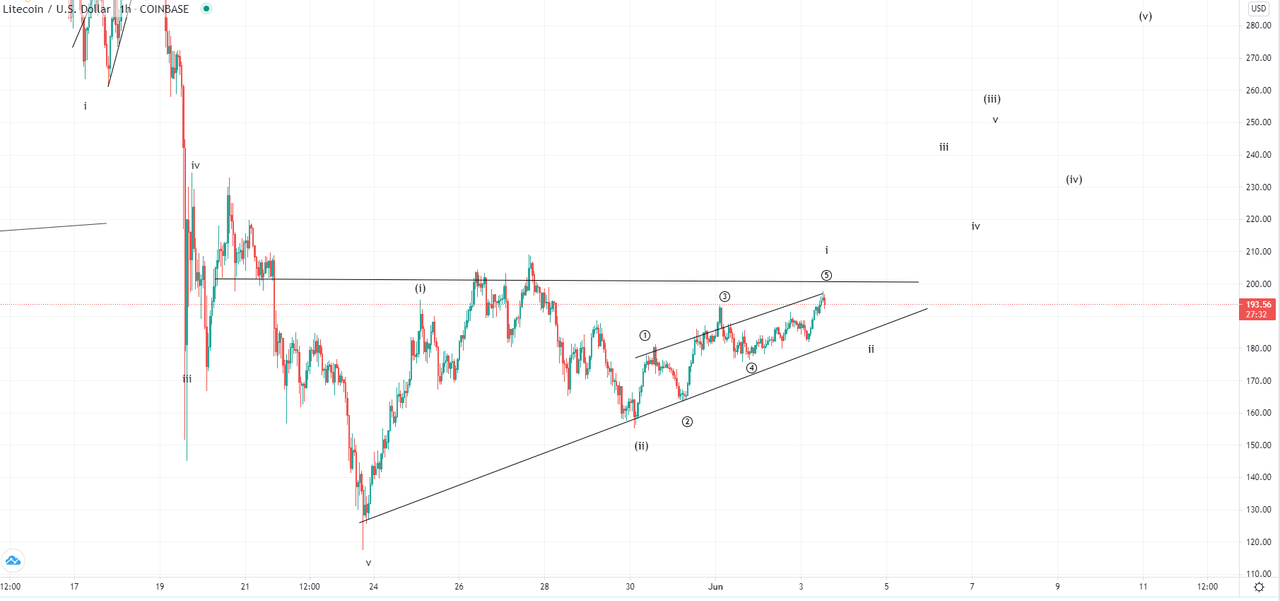
The price of Litecoin has bee on the rise since the 30th of May again after it came down to $157.3 from $207. It reached today $197 at its highest point and is now making a minor pullback.


We have seen the start of the recovery from the 23rd when it fell all the way down to $127 and even lower on the wick to the downside. This is why the recovery seen from there could be the start of the next impulsive move to the upside that is now going to develop in a five-wave manner. On the other hand, this could be another corrective stage with the price making some kind of an ABC correction after further downtrend continuation.

In the first case, we could see a breakout from the currently formed rising flat triangle on the upside which would validate the possibility of the upward momentum. But if the ascending trendline breaks out to the downside it could be an early indication that the price is headed further down below its lowest levels this year.

EOS/USD

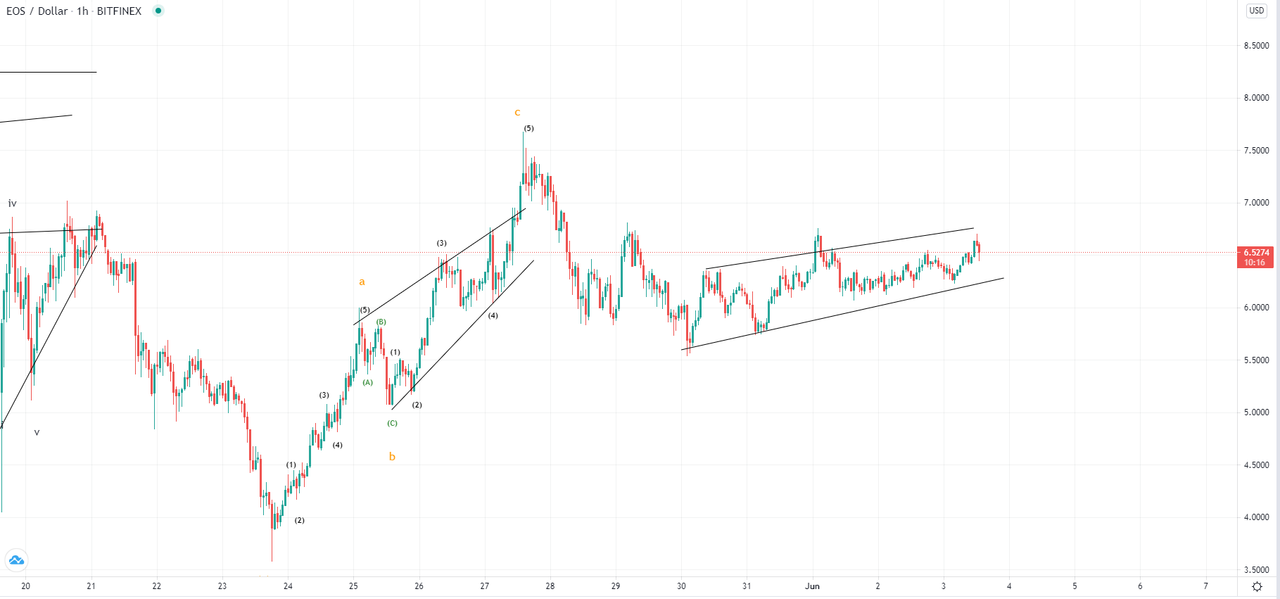
The price of EOS has been moving sideways from the 30th of May when it fell to $5.5 area from its high of $7.52. Since then it has recovered to $6.67 at its highest point today but is now sitting again lower as it encountered resistance.


On the hourly chart, you can see that the price has formed a sideways range from the 30th with slight ascending levels. This could be the start of the next impulsive move as a leading diagonal or it could be the 2nd sub-wave of the next move to the downside which is still unclear. This is why it would be safe to say that a breakout beyond its outline levels could provide an early indication of where the price is headed further.

If the price continues increasing and manages to go above the resistance levels this could meant that the price is headed further up, but if its support gets broken we could see further downtrend continuation.


FXOpen Blog


This forecast represents FXOpen Markets Limited opinion only, it should not be construed as an offer, invitation or recommendation in respect to FXOpen Markets Limited products and services or as financial advice. Cryptocurrency CFDs are not available to trade in all jurisdictions.
 
AUD/USD and NZD/USD Turn Red, Upsides Capped


AUD/USD started a major decline after it failed to clear the 0.7765 resistance. NZD/USD also declined and it broke a major support near the 0.7200 zone.

Important Takeaways for AUD/USD and NZD/USD


  • The Aussie Dollar started a fresh decline below the 0.7740 and 0.7700 support levels against the US Dollar.
  • There was a break below a major bullish trend line with support near 0.7730 on the hourly chart of AUD/USD.
  • NZD/USD also declined heavily below the 0.7200 and 0.7180 support levels.
  • There is a key bearish trend line forming with resistance near 0.7200 on the hourly chart of NZD/USD.

AUD/USD Technical Analysis

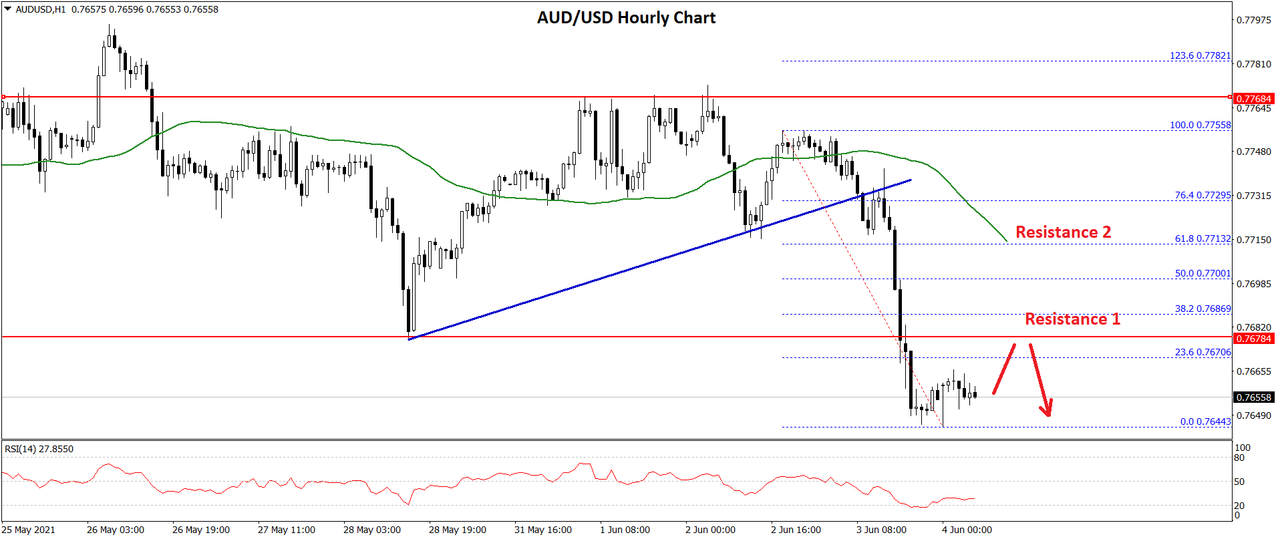
Recently, the Aussie Dollar made a few attempts to clear the 0.7765 resistance zone against the US Dollar. The AUD/USD pair failed to gain momentum and it started a major decline below 0.7750.

It broke the 0.7700 support level and settled well below the 50 hourly simple moving average. The pair even broke the 0.7675 support level and extended its decline. It traded as low as 0.7644 on FXOpen and it is currently consolidating losses.


An initial resistance on the upside is near the 0.7670 level. It is near the 23.6% Fib retracement level of the recent decline from the 0.7755 high to 0.7644 low.

The first major resistance is near the 0.7675 level (the recent breakdown zone). The next major resistance is near the 0.7700 level. It is close to the 50% Fib retracement level of the recent decline from the 0.7755 high to 0.7644 low.

Any more gains could lead the pair towards the 0.7715 level and the 50 hourly simple moving average. Conversely, the pair could further decline below the 0.7650 support zone.

The next major support is near the 0.7640 level. If there is a downside break below the 0.7640 level, the pair could extend its decline towards the 0.7580 level.


Read Full on FXOpen Company Blog...
 
GBP/USD and EUR/GBP: British Pound Could Correct Lower


GBP/USD failed to clear the key 1.4200 resistance zone and corrected lower. EUR/GBP is rising and it might continue to rise towards the 0.8650 level.

Important Takeaways for GBP/USD and EUR/GBP


  • The British Pound failed to gain pace above the main 1.4200 resistance zone.
  • There is a key bearish trend line forming with resistance near 1.4175 on the hourly chart of GBP/USD.
  • EUR/GBP started a fresh increase after it found a strong support near the 0.8565 zone.
  • There was a break above a major bearish trend line with resistance near 0.8590 on the hourly chart.

GBP/USD Technical Analysis

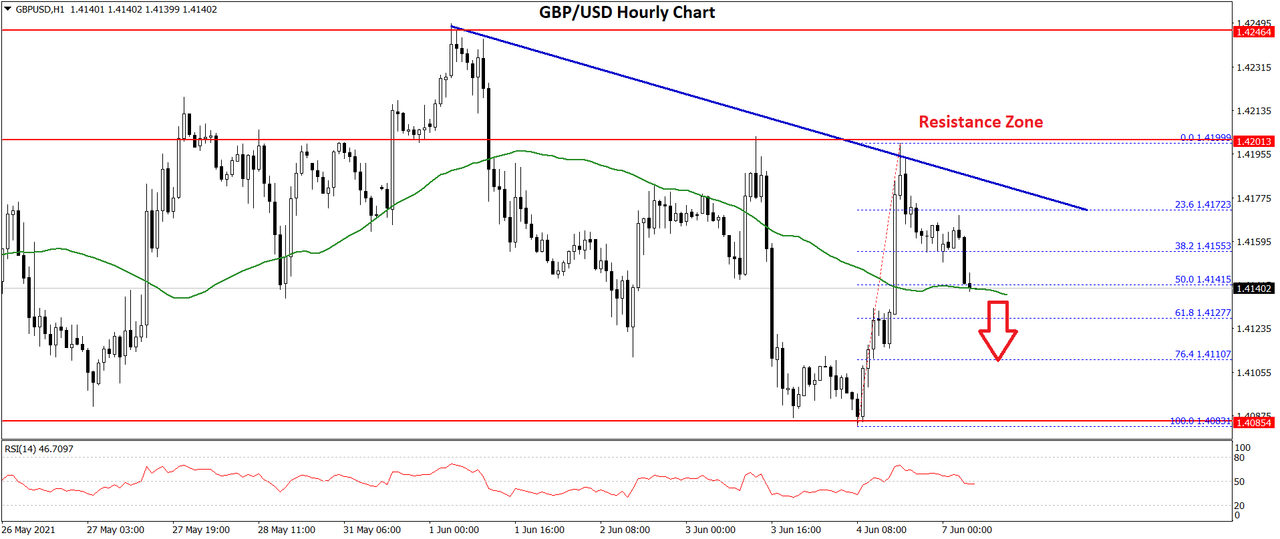
The British Pound started a fresh increase from the 1.4080 support zone against the US Dollar. The GBP/USD pair climbed above the 1.4150 resistance and the 50 hourly simple moving average.

However, the pair failed to gain pace above the 1.4200 resistance. It traded as high as 1.4199 on FXOpen and it is now correcting gains. There was a break below the 1.4165 support level. The bears pushed the pair below the 23.6% Fib retracement level of the upward move from the 1.4083 swing low to 1.4199 high.

The pair is now testing the 1.4140 level and the 50 hourly simple moving average. It is close to the 50% Fib retracement level of the upward move from the 1.4083 swing low to 1.4199 high.


A downside break below 1.4140 could set the pace for a fresh decline towards the 1.4100 support. The main support is still near 1.4080, below which the pair could dive towards 1.4000.

On the upside, an immediate resistance is near the 1.4170 level. There is also a key bearish trend line forming with resistance near 1.4175 on the hourly chart of GBP/USD. The next major resistance is near the 1.4200 level.

A successful close above 1.4170 and a follow up move above 1.4200 could open the doors for a move towards the 1.4250 resistance.


Read Full on FXOpen Company Blog...
 
Weak US Dollar Ahead of Critical Inflation Data


The US dollar reacted strongly to the June NFP report released last Friday and declined across the board. The US economy added fewer than expected jobs in May, but the unemployment rate declined to 5.8%.

The reaction in the dollar may have come as a result of traders and other market participants preparing for the inflation data later this week. On Thursday, right when the European Central Bank is presenting its June decision, the Consumer Price Index (CPI) from the United States is released.


Rising Inflation – Bullish or Bearish for the US Dollar

One month ago, the US dollar declined on the CPI release. The April headline and core inflation data showed rising prices, and the dollar took a dive.

However, dollar bears should keep in mind two things. First, it is not the first time in history when higher inflation may lead to a stronger, not a weaker, dollar. A close look at what happened in the 1970s, a period known as one with higher inflation, will show that the dollar may get stronger on rising prices.

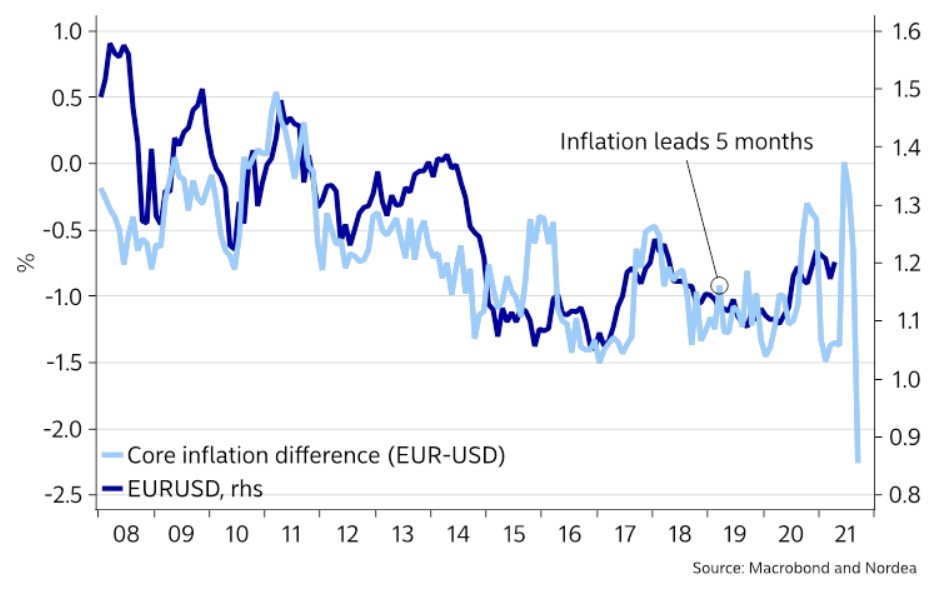
Second, the core inflation difference between Europe and the United States suggests we may see a stronger dollar in the second half of the year. The core inflation difference leads five months, and so far it correlated perfectly with the EUR/USD exchange rate. More precisely, it points to a much lower EUR/USD than the current levels, something that dollar bears may want to consider.

This week, the ECB monetary policy decision will trigger volatility on the euro pairs, but the market participants will also look at the tapering message. Next week it is the Fed’s turn to talk about tapering, and the difference between the two statements will be the driver for the EUR/USD exchange rate.


FXOpen Blog
 
BTC and XRP – Breakout seen with further downside expected


BTC/USD

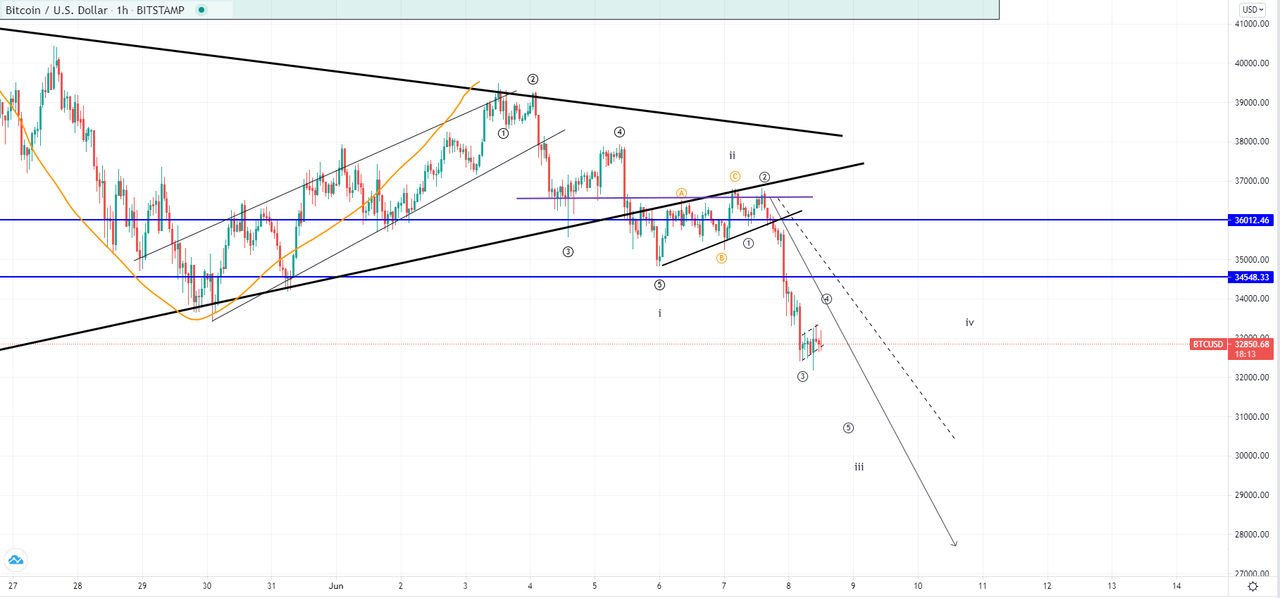
The price of Bitcoin has been on a decline since yesterday and from its high at $36,742 made a decrease of 11.67% measured to its lowest point today at $32,455. Currently, it is sitting at $32,850 as a minor recovery was made but the picture still looks breaking with more downside expected.


Looking at the hourly chart, you can see that the price has made a continuation of the descending move from the 3rd of June. A breakout was made from the ascending support on the 5th after which a test of prior support for resistance. As resistance was present the price continued moving further to the downside and breaking out from the horizontal levels. This is most likely the development of the 3rd wave out of the higher degree five-wave impulse that started on the 3rd of June.

If this is true then the price of Bitcoin is now headed to the vicinity of the $30,000 area where the next support level is. Recovery of the 4th wave could be seen but the projection takes back Bitcoin even further to the downside at around $27,500 area for the completion of the impulsive move.


Read Full on FXOpen Company Blog...
 
EUR/USD Eyes Upside Break, USD/JPY Faces Uphill Task


EUR/USD is showing positive signs above the 1.2150 pivot level. USD/JPY could extend its decline unless it clears the 109.60 resistance zone in the near term.

Important Takeaways for EUR/USD and USD/JPY


  • The Euro started a fresh increase from the 1.2100 support zone.
  • There is a key bearish trend line forming with resistance near 1.2185 on the hourly chart of EUR/USD.
  • USD/JPY declined below the 109.90 and 109.60 support levels.
  • There was a break below a major bullish trend line with support near 109.75 on the hourly chart.

EUR/USD Technical Analysis

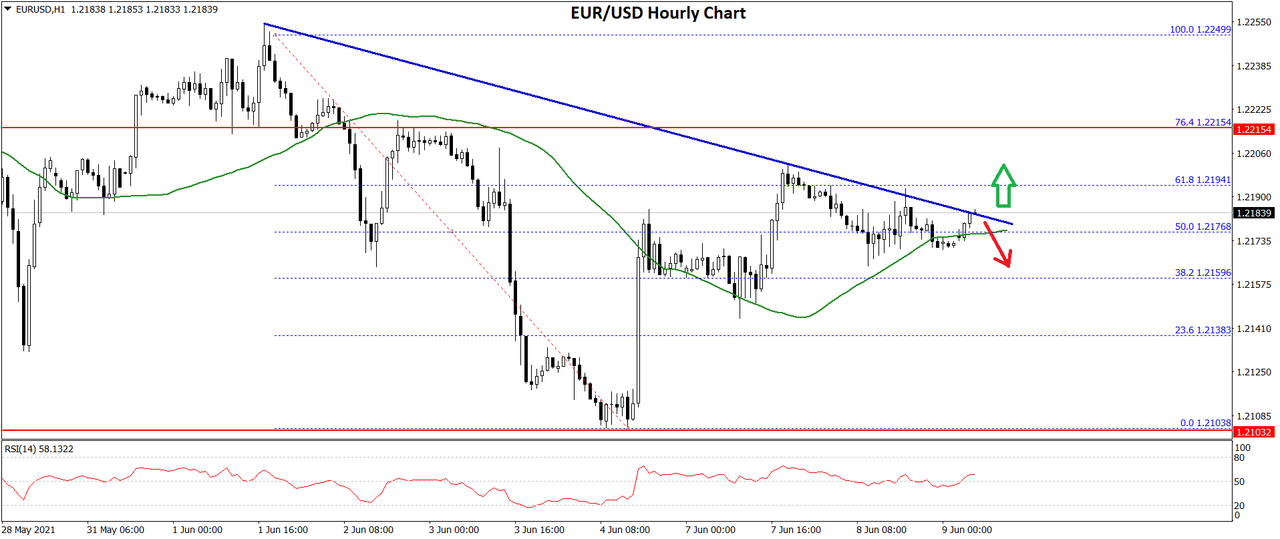
Recently, the Euro saw a downside correction from well above the 1.2200 level against the US Dollar. The EUR/USD pair broke the 1.2150 support level and extended its decline.

However, the bulls were active above the 1.2100 level. A low was formed near 1.2103 on FXOpen and the pair is now rising. There was a break above the 1.2120 and 1.2150 resistance levels.


The pair even climbed above the 50% Fib retracement level of the recent decline from the 1.2249 high to 1.2103 low. It is now trading above the 1.2165 level and the 50 hourly simple moving average. The pair is now attempting an upside break above 1.2185 and 1.2190.

There is also a key bearish trend line forming with resistance near 1.2185 on the hourly chart of EUR/USD. The next key resistance is near the 1.2215 level.

The 76.4% Fib retracement level of the recent decline from the 1.2249 high to 1.2103 low is also near the 1.2215 level. A clear upside break above the trend line and then 1.2215 could open the doors for a larger increase. In the stated case, the pair could rise towards the 1.2250 level.

An intermediate support is near the 1.2175 level and the 50 hourly simple moving average. The next major support is near the 1.2150 level, below which the pair could drop towards the 1.2100 support.


Read Full on FXOpen Company Blog...
 
LTC and EOS – Correction could have ended but further confirmation is needed


LTC/USD

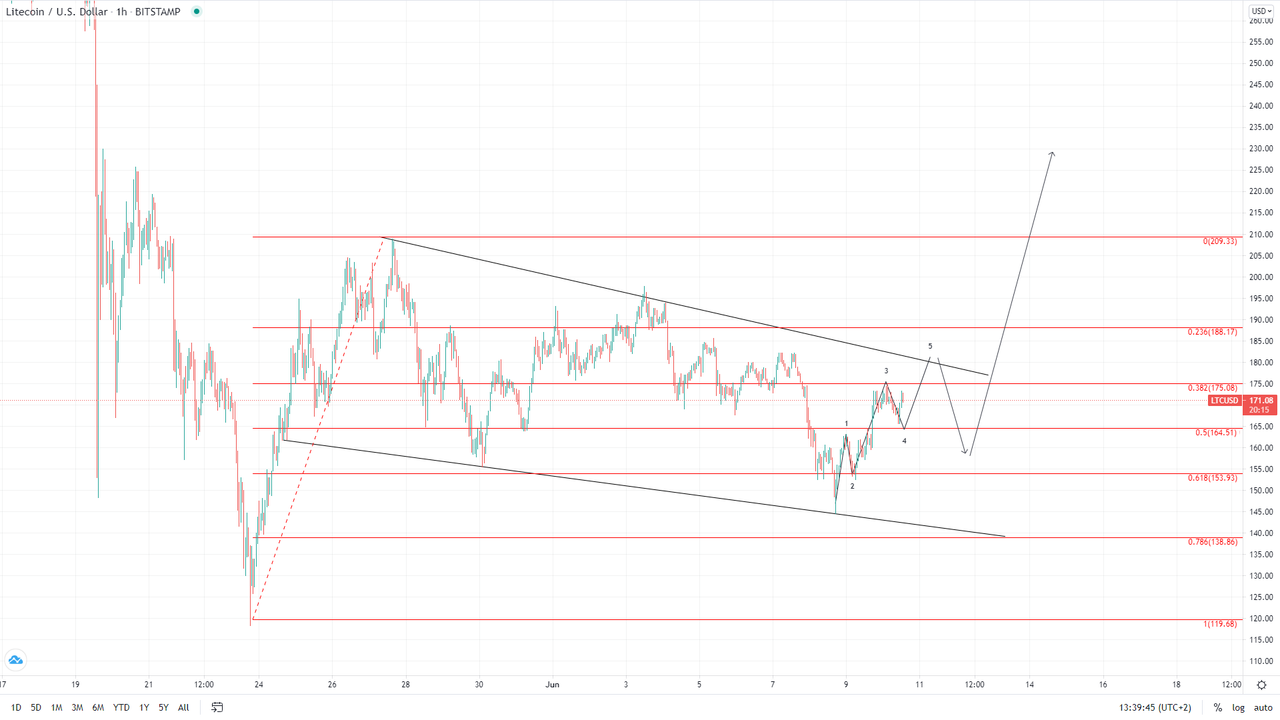
The price of Litecoin has been on the rise since Tuesday when it fell down to $144.36. From there we have seen an increase of 21.5% measured to its highest point today at $175. A minor pullback was made but again a rise with the price currently sitting slightly lower than its highest point today.


On the hourly chart, you can see that the price of Litecoin is still in a descending triangle from the 26th of May. Another interaction with its resistance level could be expected during the day as the 5th wave from the starting five-wave impulse from Tuesday. This could be the start of the higher degree upward move after the three-wave correction ended on the 8th in which case after a retracement we are to see a breakout from the upside.

The picture still looks corrective which is why we could be seeing the 4th wave out of the five-wave correction move from the 26th in which case the price of Litecoin could fall back to a lower low compared to the one on the 8th of June. This is why we are going to see from the interaction with the descending resistance if the price gets rejected and the depth of the expected retracement which scenario would be in play.

If it lands on the 0.5 Fib level or slightly lower and finds support there on the expected retracement that could be an early sign for a potential breakout to the upside.


Read Full on FXOpen Company Blog...
 
Gold Price and Oil Price Eye Additional Gains


Gold price is showing positive signs above the $1,880 resistance zone. Crude oil price is holding a major support, but it is facing resistance near $70.00.

Important Takeaways for Gold and Oil


  • Gold price gained pace above the $1,875 and $1,880 resistance levels against the US Dollar.
  • There was a break above a key bearish trend line with resistance near $1,894 on the hourly chart of gold.
  • Crude oil price climbed higher and it even cleared the $70.00 resistance zone.
  • There is a crucial bullish trend line forming with support near $69.00 on the hourly chart of XTI/USD.

Gold Price Technical Analysis

This week, gold price remained in a positive zone above the $1,865 level against the US Dollar. The bulls were able to push the price above the $1,880 resistance zone.

The price even settled above the $1,885 level and the 50 hourly simple moving average. There was a break above a key bearish trend line with resistance near $1,894 on the hourly chart of gold.


A high is formed near $1,900 on FXOpen and the price is now consolidating gains. An initial support on the downside is near the $1,893 level. It is close to the 23.6% Fib retracement level of the recent increase from the $1,870 swing low to $1,900 high.

The first major support is near the $1,890 level and the 50 hourly simple moving average. The next key support is near the $1,885 level.

The 50% Fib retracement level of the recent increase from the $1,870 swing low to $1,900 high is also near the $1,885 level. Any more losses could open the doors for a move towards the $1,870 low.

An initial resistance is near the $1,905 level. The first major resistance is near the $1,910 level. A clear break above the $1,910 level may possibly open the doors for a move towards the $1,925 level. The next major resistance sits near $1,935.


Read Full on FXOpen Company Blog...
 
Best-Performing May 2021 PAMM Accounts


For those who prefer summertime investing, below is an overview of FXOpen’s top-performing PAMM accounts as of May 2021. We hope that this review will make it easier for you to choose which PAMM managers active on the FXOpen platform you should pay attention to and, possibly, add them to your investment portfolio.

At the same time, this article provides insight into traders’ performance in the Money Managers contest that was launched on March 1, 2021, and will end at the end of June. The objective of the competition is to show low-risk high trading activity while the drawdown does not exceed 20%.

Read Full on FXOpen Company Blog...
 
Last edited by a moderator:
GBP/USD and GBP/JPY: British Pound Eyes Fresh Increase


GBP/USD is trading nicely above the main 1.4080 support zone. GBP/JPY is recovering and it could rally if there is a clear break above the 155.00 resistance zone.

Important Takeaways for GBP/USD and GBP/JPY


  • The British Pound is trading in a range above the 1.4080 support against the US Dollar.
  • There is a key bullish trend line forming with support near 1.4100 on the hourly chart of GBP/USD.
  • GBP/JPY is showing a few positive signs above the 154.50 support zone.
  • There is a major bearish trend line forming with resistance near 155.00 on the hourly chart.

GBP/USD Technical Analysis

In the past few sessions, the British Pound mostly traded in a range below the 1.4200 resistance zone against the US Dollar. The GBP/USD pair declined recently after it failed to settle above 1.4180.

There was break below the 1.4150 support level and the 50 hourly simple moving average. The pair even traded below 1.4100, but it remained well bid above the 1.4080 level. A low is formed near 1.4086 on FXOpen and the pair is currently consolidating.


There was a break above the 1.4100 level. The pair recovered above the 23.6% Fib retracement level of the recent decline from the 1.4184 high to 1.4086 low.

On the upside, an initial resistance on the is near the 1.4135 level. It is close to the 50% Fib retracement level of the recent decline from the 1.4184 high to 1.4086 low. The next key resistance is near the 1.4150 level, above which the pair could rise towards the main 1.4200 resistance.

On the downside, there is a key bullish trend line forming with support near 1.4100 on the hourly chart of GBP/USD. If there is a break below the trend line support, the pair could test the 1.4080 support. If there are additional losses, the pair could decline towards the 1.4000 level.


Read Full on FXOpen Company Blog...
 
Core US Inflation – The Highest Two-Months Increase in Three Decades


The US inflation data for the month of May was released last week. The data came out at the same time as the European Central Bank started its monetary policy meeting last Thursday.

Because the two events were the main events of the trading week, the markets did not move in the prior days. In fact, the ranges on most of the FX pairs were so tight that one may have argued that summer trading conditions are already here.

When the Consumer Price Index (CPI) was released, it showed that the prices of goods and services in May were increasing much faster than expected. As always, the CPI comes in two versions – the headline report and the core report. The latter is the one that matters for the Fed because it is not considering the food and energy prices – too volatile to be included in the report.

The headline CPI data for the month of May was expected to increase by 0.4% – it came out at 0.6% on a month-over-month basis. Also, the core data was expected at 0.5% – it came out at 0.7%.

With both headline and the core CPI beating expectations by a mile, coupled with the inflation data for the previous months, we see the highest two-month increase in inflation in three decades.


What About the Fed?

The Federal Reserve of the United States (Fed) has a dual mandate. To create jobs and to maintain price stability.

Naturally, inflation refers to the price stability part of the Fed’s mandate, and this one changed during the pandemic. More precisely, the Fed shifted its inflation mandate last August, from targeting 2% to averaging 2%. Out of the two releases, the Fed focuses on the core CPI.

Yet, the Fed did not mention so far what is period it considers when averaging inflation. The longer the period, the more it will allow inflation to rise.

At the start of the 1970s, as inflation escalated, then US President Nixon abandoned the Bretton Woods system, shocking financial markets and the international community. At the end of that decade, the Fed’s Chair, Paul Volcker, introduced bold anti-inflationary measures because inflation exceeded 13% on an annualized basis.

Last week’s data means that the core CPI reached 3.8% in the United States on an annualized basis. Central banks like the Fed argue that this is transitory and that the prices will cool down eventually.

While there is a long way to 13%, no one is expecting the Fed to raise the rates as Volker did back in 1979. Instead, all the Fed should do is to signal the tapering of its asset purchases. That might do the trick to stop the upside pressures on the prices of goods and services, and the Fed has the chance to do so this week, at its Wednesday meeting.

FXOpen Blog
 
BTC and XRP – Recovery could end soon


BTC/USD

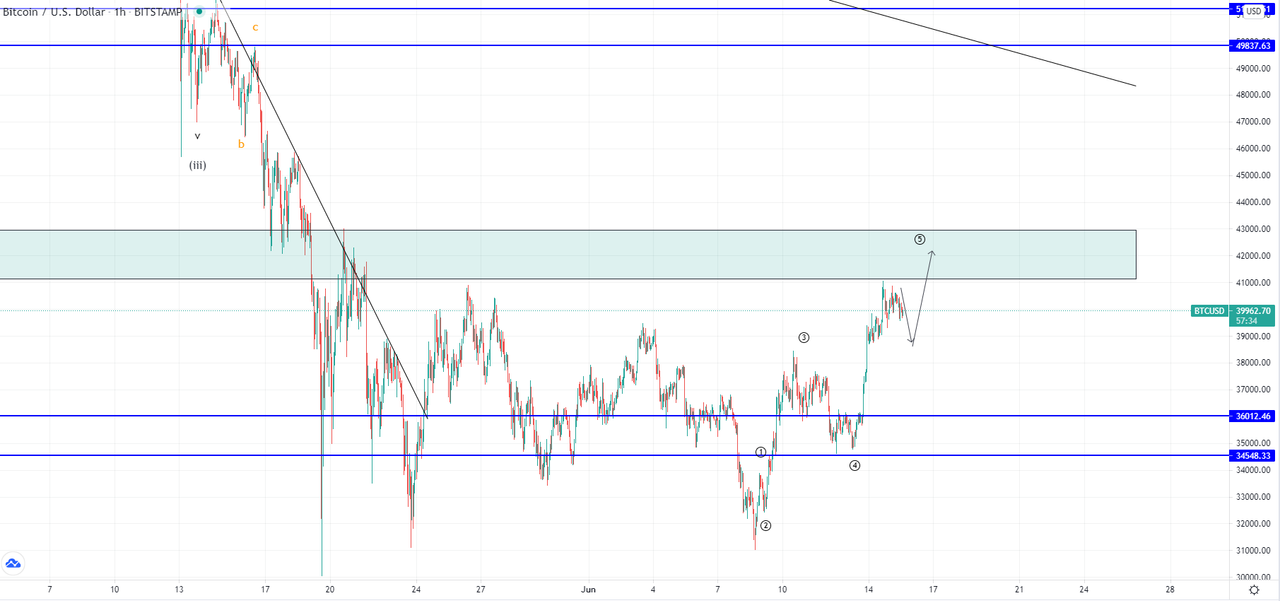
The price of Bitcoin has been on the rise since the 8th of June when it fell to the $31,000 zone again. From there we have seen an increase of 31% measured to its highest point yesterday at $40,750. Now it is being traded slightly lower but is still in an upward trajectory overall.


You can see that the price fell for the third time to the $31,000 zone on the 8th of June on the hourly chart. This was done in a three-wave manner from the May 26th high but also from its June 3rd high. This creates a problem in counting waves as there isn’t still a clear sign that the price bottomed out. However for now we can assume that the price found support again on the 8th after which we have seen an impulsive rise. This could be an indication that we have seen the start of a new wave to the upside which is set to recover the price more significantly.

If this is true then the price should now develop a five-wave pattern which is why a higher high from here could be expected to the vicinity of the horizontal range of $42,000. After that the 2nd wave of the higher degree count should retrace the price before a breakout above the zone.


Read Full on FXOpen Company Blog...
 
LTC and EOS – Was the correction over?


LTC/USD

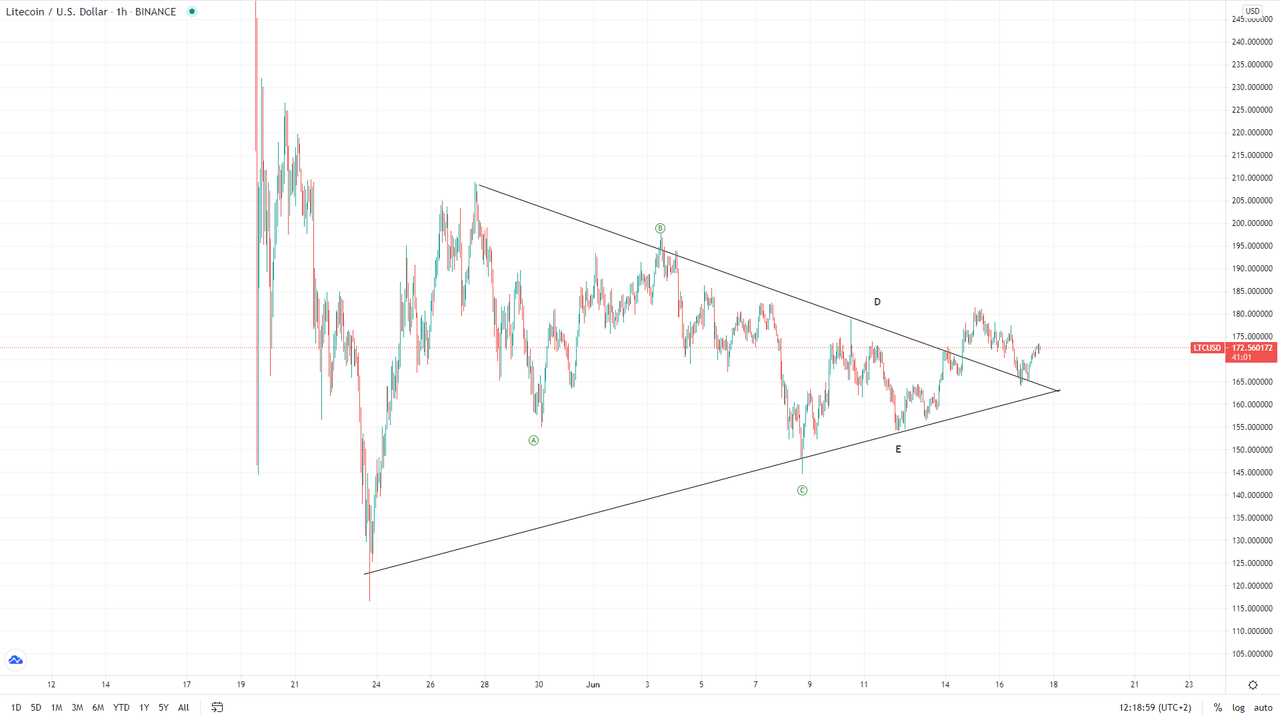
The price of Litecoin has been in recovery from the 8th of June when it fell to around $146 at its lowest point. From there the price went on to form a higher low and higher high to $180 area, breaking out from the symmetrical triangle in which it was since the 27th of May. Today we have seen a pullback as a retest of the prior resistance for support, and as support was present we have seen a bounce from there. Currently, the price is being traded at $172.5 area and is still moving in an upward trajectory.


Looking at the hourly chart you can see that the price of Litecoin most likely ended its corrective stage on the 8th of June. This could have been an ABC correction from the 27th of May when the first impulsive move was seen. If so, then from the 8th we have seen the start of another impulse wave to the upside. Another possibility in a positive scenario could be that the price made a five-wave correction count ABCDE to the 12th of June from where the next impulse started. In that case the price has made a three-wave increase with the today seen pullback being its 4th wave out of the five-wave impulse.

Now in both of these positive scenarios, the price would be expected to go higher to the upside in an impulsive manner and make a higher high compared to the one on the 27th of May when the price reached $208.89.

However, there is a negative scenario still in play. If the price ended its three-wave ABC correction on the 8th of June the next structure could end as a three-wave correction to the upside before another downfall. In that case, the price could continue its downward trajectory in the short-term and fall back below the triangle’s resistance level and also the starting point of the prior increase at about $154.3.


Read Full on FXOpen Company Blog...
 
GBP/USD Nosedives, USD/CAD Starts Major Increase


GBP/USD started a sharp downward move after it failed to clear 1.4200. USD/CAD is surging and it recently cleared the 1.2440 resistance zone.

Important Takeaways for GBP/USD and USD/CAD


  • The British Pound started a fresh decline from well above the 1.4100 level.
  • There is a key bearish trend line forming with resistance near 1.3850 on the hourly chart of GBP/USD.
  • USD/CAD gained bullish momentum above the 1.2350 and 1.2400 resistance levels.
  • There is a major bullish trend line forming with support near 1.2410 on the hourly chart.

GBP/USD Technical Analysis

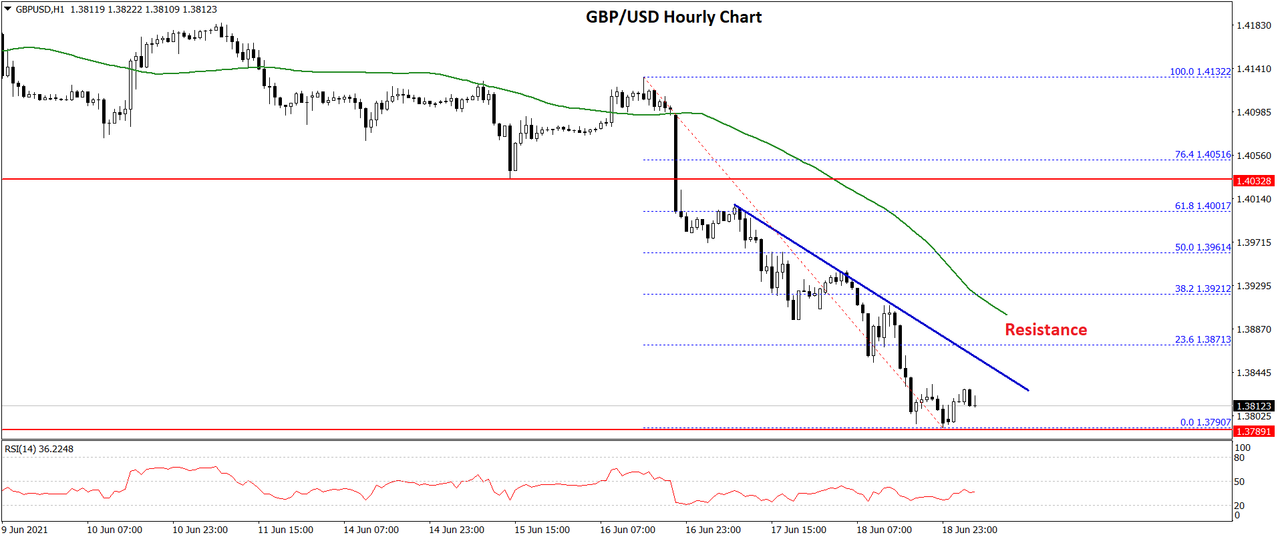
The British Pound made a couple of attempts to settle above 1.4150 and clear 1.4200 against the US Dollar. However, the GBP/USD pair failed to continue higher, and it started a fresh decline from well above the 1.4100 level.

The pair gained bearish momentum below the key 1.4000 support zone. There was a clear break below the 1.3920 support level and the 50 hourly simple moving average. The pair even broke the 1.3840 support and traded as low as 1.3790 on FXOpen.


The pair is now consolidating losses above the 1.3800 level. An initial resistance on the upside is near the 1.3840 level. There is also a key bearish trend line forming with resistance near 1.3850 on the hourly chart of GBP/USD.

The next hurdle is near the 23.6% Fib retracement level of the downward move from the 1.4132 swing high to 1.3790 low. The main hurdle is near the 1.3900 level and the 50 hourly simple moving average.

Any more gains could lead the pair towards the 50% Fib retracement level of the downward move from the 1.4132 swing high to 1.3790 low. An initial support on the downside is near the 1.3800 level. The first major support is near the 1.3780 level.

Any more losses could open the doors for a move towards the 1.3720 support zone. The next major support sits near the 1.3650 level.


Read Full on FXOpen Company Blog...
 
The Federal Reserve Turns Hawkish, Sending the US Dollar Higher


Last Wednesday, the Federal Reserve of the United States (Fed) took financial markets by surprise. It delivered a hawkish message, as suggested by the dot plot that showed two possible rate hikes in 2023, rather than just one as the market participants expected.

As a reminder to all traders and investors, the Fed has a dual mandate – to maintain price stability and to create jobs. It delivers its monetary decisions based on interpreting the balance between the two parts of its mandate.

While job creation posed challenges due to the coronavirus pandemic, the Fed had an easier task fulfilling the inflation-targeting mandate.

Like most central banks in the developed world, the Fed targets inflation close to 2%. Or, at least it used to have this target.

It changed it last August. At the Jackson Hole Symposium last August, the Fed shifted its inflation target from reaching close to 2% to averaging 2%. From that moment on, speculations mounted as to what is the period the Fed will consider for averaging inflation.

Based on its recent decision, it appears that inflation, and not employment, is a concern for the Fed.
US Dollar Ripping Higher on Hawkish Fed

One may say that the Fed took markets by surprise, but the staff’s economic projections left no other choice. The US economic growth forecast was lifted higher for both 2021 and 2023, and so was the inflation forecast.

As such, the Fed raised the interest rate on excess reserves by five basis points in a first attempt to normalize rates. Judging by the market’s reaction, they were taken by surprise as the US dollar gained across the board on the Fed’s message.

The EURUSD pair closed the week well below 1.19, after trading with a bid tone above 1.21 for most of the past two months. Also, the AUDUSD or the GBPUSD lost ground, in a piece of further evidence that the US dollar bears were taken by surprise.

Moving forward, it remains to be seen what will other central banks do. Brazil already reacted, by raising the interest rates, in a classic move from an emerging market’s central bank after the Fed turns hawkish.

The big question is – what will other central banks from the developed world do? The first one to watch is the Bank of England, as the Monetary Policy Committee is due to deliver its decision this upcoming Thursday.


FXOpen Blog
 
About FXOpen

FXOpen has been offering Forex brokerage services since 2005 and is currently one of the most successful and fastest-growing Forex brokers.

Since the very start FXOpen has been true and loyal to its goal - making Forex trading more professional, easy-to-access and secure. FXOpen was founded by a group of traders so everything we do has the traders' interests at its core.

Account Types:

  • MICRO – Floating Spreads – No Commissions – Minimum Deposit 1USD
  • STP – Tight Spreads – No Commissions – Minimum Deposit 10USD
  • ECN – Raw Spreads – Commissions from 1.5 units per lot – Minimum Deposit 100USD
  • CRYPTO – Tight Spreads – Commissions 0.25% of transaction volume – Minimum Deposit from 10USD

Platforms:
  • Meta Trader 4 – Available for ECN, Crypto, STP and Micro accounts – for PC Desktop, iPhone and Android.
  • Meta Trader 5 – Available for ECN accounts – for PC Desktop, iPhone and Android.
  • Tick Trader – Available as Web Terminal, Desktop Terminal and Mobile Terminal for Forex, Stocks, Commodities, Indices, and Cryptocurrencies via one trading account.
  • Web Trader – Accessible with no download on PC or Mac OS. Compatible with all operating systems, Supports all popular browsers

Trading Instruments:
  • FX Spot
  • Stocks CFD, Index CFD
  • Commodities CFD
  • Metals CFD
  • Crypto Currencies
Multilingual Live Chat: Our Support Team is available 24/5 via Live Chat, Ticket, E-mail and Phone.

Headquarters: P.O. Box 590, Springates East, Government Road, Charlestown, Nevis.

Other offices: United Kingdom, Australia, New Zealand, Cyprus.

IS THERE ANY GOOD MT5 INDICATORS
 
BTC and XRP – Recovery shortly expected


BTC/USD


The price of Bitcoin has been on a decline since the 15th of June when it was trading at $41,151 at its highest point. From there we have seen a decrease of 24.5% measured to its lowest point today at around $31,240. Now the price is slightly higher but is currently testing the horizontal support level from the 23rd of May.

On the 4-hour chart, we can see that this is the third time the price has been trading on its lower level of the horizontal range that formed from the 23rd of May. But doing so it weakened the level which is why it potentially won’t hold for much longer. However, the wave structure implies that we might see a recovery shortly at least as the 2nd sub-wave of the next three-wave correction to the downside after which we could see a larger recovery.

From here a breakout to the downside isn’t so likely but rather the price could now find another support here and bounce but only for a lower high compared to the one on the 15th of June. Another possibility would be that from the 8th till the 15th of June we have seen the 3rd wave out of the higher degree correction with its first wave being the upward move from the 23rd till the 26th of May. In that case, the price could continue its downside trajectory but also in the near term a move to the upside would now be expected.


Read Full on FXOpen Company Blog...
 

Create an account or login to comment

You must be a member in order to leave a comment

Create account

Create an account on our community. It's easy!

Log in

Already have an account? Log in here.

Similar threads

Users Who Are Viewing This Thread (Total: 1, Members: 0, Guests: 1)

Top
AdBlock Detected

We get it, advertisements are annoying!

Sure, ad-blocking software does a great job at blocking ads, but it also blocks useful features of our website. For the best site experience please disable your AdBlocker.

I've Disabled AdBlock    No Thanks