Vlad RF
Well-Known Member
How to Trade the Kicker Candlestick Pattern
Author : Victor Gryazin

Dear Clients and Partners,
In this review, we will get acquainted with a rather rare reversal candlestick pattern called Kicker. We will consider the features of its formation and the rules of trading with it.
How a Kicker candlestick pattern is formed
The Kicker candlestick pattern is not often seen on price charts and portends a reversal of the current trend, showing a sudden change in market sentiment. It is usually caused by important or unexpected news related to an asset.
A pattern consists of two candles of different colours: if the first is white, the second is black, and vice versa. The size of the body of the candles does not particularly matter. The body of the first candle follows the direction of the current trend, and the second candle opens with a gap from the opening price of the first candle and closes in the opposite direction.
The peculiarity of this pattern is that the second candle opens immediately with a large gap against the direction of the trend. If the first candle of the pattern is "bearish", the gap widens, and a white candle appears; if the first candle is "bullish", the gap shrinks, and a black candle follows. The gap covers the whole body of the first candle and forms a gap with its opening price.
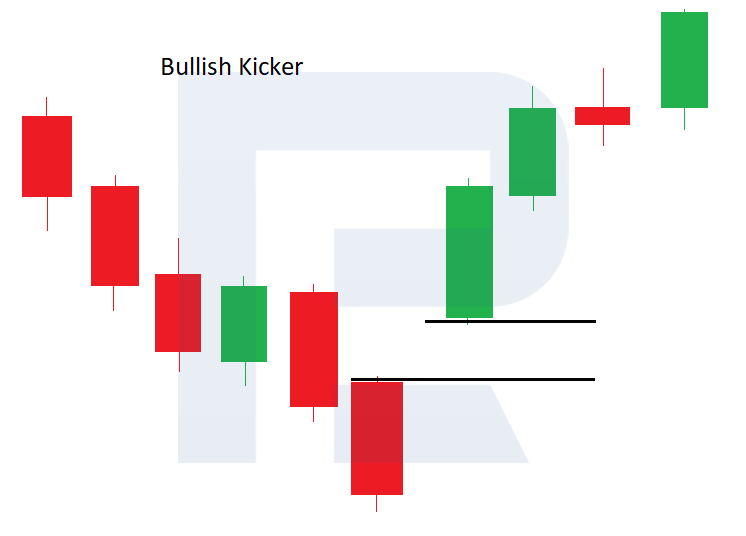
A bullish Kicker candlestick pattern
This forms on the price chart during a downtrend when there is an active downward price movement and local lows are formed. First, the first black candle of the pattern appears, then the second candle opens with a large gap upwards and closes in white, showing growth. The "bears" were moving the market down, confident in their strength, but unexpected positive news strongly influenced market participants, and the situation changed dramatically. Now, the "bulls" have taken the initiative.
Thus, a bullish candlestick pattern Kicker has been formed on the chart. It is fully formed after the closing of the second candle with a white body, and it is assumed that the bulls, having received unexpected support and going on the offensive, will continue to move the price upwards. Thus, we can expect a severe upward correction or even a reversal and the start of a bullish trend.
Bearish candlestick pattern Kicker
This forms on the price chart during an uptrend, which is when there is a strong upward price movement and local highs are formed. First, the first white candle of the pattern appears, then the second candle opens with a large downward gap and closes in black, showing a decline. "The bulls" had been driving the market upwards with a strong initiative, but unexpected negative news strongly influenced the market participants, and the situation changed dramatically: now the bears have taken the initiative.
So, a bearish Kicker candlestick pattern has been formed on the chart. It is fully formed after the second candle closes with a black body, and it is expected that the "bears", having received unexpected support and going on the offensive, will continue to move the quotes downwards. Thus, we can expect a severe downtrend or even a reversal and the start of a bearish trend.
How to buy on a bullish Kicker pattern
Sincerely,
RoboForex team
Author : Victor Gryazin

Dear Clients and Partners,
In this review, we will get acquainted with a rather rare reversal candlestick pattern called Kicker. We will consider the features of its formation and the rules of trading with it.
How a Kicker candlestick pattern is formed
The Kicker candlestick pattern is not often seen on price charts and portends a reversal of the current trend, showing a sudden change in market sentiment. It is usually caused by important or unexpected news related to an asset.
A pattern consists of two candles of different colours: if the first is white, the second is black, and vice versa. The size of the body of the candles does not particularly matter. The body of the first candle follows the direction of the current trend, and the second candle opens with a gap from the opening price of the first candle and closes in the opposite direction.
The peculiarity of this pattern is that the second candle opens immediately with a large gap against the direction of the trend. If the first candle of the pattern is "bearish", the gap widens, and a white candle appears; if the first candle is "bullish", the gap shrinks, and a black candle follows. The gap covers the whole body of the first candle and forms a gap with its opening price.
A bullish Kicker candlestick pattern
This forms on the price chart during a downtrend when there is an active downward price movement and local lows are formed. First, the first black candle of the pattern appears, then the second candle opens with a large gap upwards and closes in white, showing growth. The "bears" were moving the market down, confident in their strength, but unexpected positive news strongly influenced market participants, and the situation changed dramatically. Now, the "bulls" have taken the initiative.
Thus, a bullish candlestick pattern Kicker has been formed on the chart. It is fully formed after the closing of the second candle with a white body, and it is assumed that the bulls, having received unexpected support and going on the offensive, will continue to move the price upwards. Thus, we can expect a severe upward correction or even a reversal and the start of a bullish trend.

Bearish candlestick pattern Kicker
This forms on the price chart during an uptrend, which is when there is a strong upward price movement and local highs are formed. First, the first white candle of the pattern appears, then the second candle opens with a large downward gap and closes in black, showing a decline. "The bulls" had been driving the market upwards with a strong initiative, but unexpected negative news strongly influenced the market participants, and the situation changed dramatically: now the bears have taken the initiative.
So, a bearish Kicker candlestick pattern has been formed on the chart. It is fully formed after the second candle closes with a black body, and it is expected that the "bears", having received unexpected support and going on the offensive, will continue to move the quotes downwards. Thus, we can expect a severe downtrend or even a reversal and the start of a bearish trend.
How to buy on a bullish Kicker pattern
- During a downtrend, a bullish Kicker pattern forms on the price chart.
- It is recommended to open a buy position at the opening of the next candle after forming the pattern. Stop Loss can be set at the low of the first black candle.
- The Fibonacci retracement lines and significant resistance levels can be used to set Take Profit.
Sincerely,
RoboForex team


