Vlad RF
Well-Known Member
How to Use Standard Deviation Indicator in Trading
Author: Victor Gryazin

Dear Clients and Partners,
Today the article is devoted to the Standard Deviation indicator. It helps evaluate the dynamics of volatility of a financial instrument and find promising entry points.
What the indicator shows
Standard Deviation (STDev) is a trading instrument that shows how far the price of a financial instrument deviates from standard values of a certain period. It shows the deviation from a Simple Moving Average and thus helps to assess the change in the price volatility.
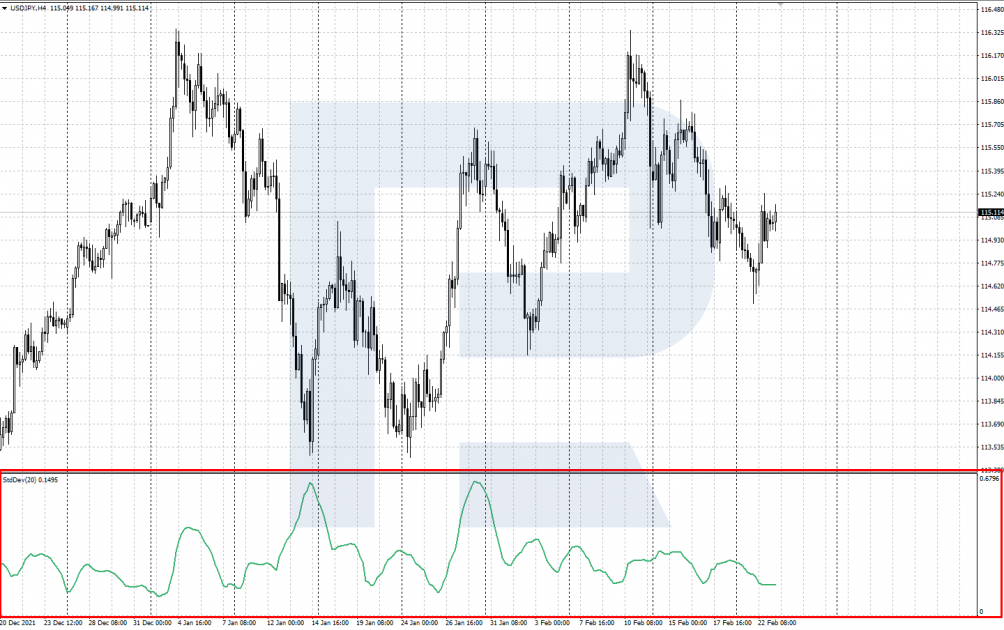
The indicator conditionally belongs to trend ones: when it grows, this might mean the beginning of a new market trend. The higher the volatility and the more the price fluctuates from the average over the chosen period, the higher STDev values will be. And vice versa: if the quotes are stable, trading in a narrow price range, indicator values will fall to the lows.
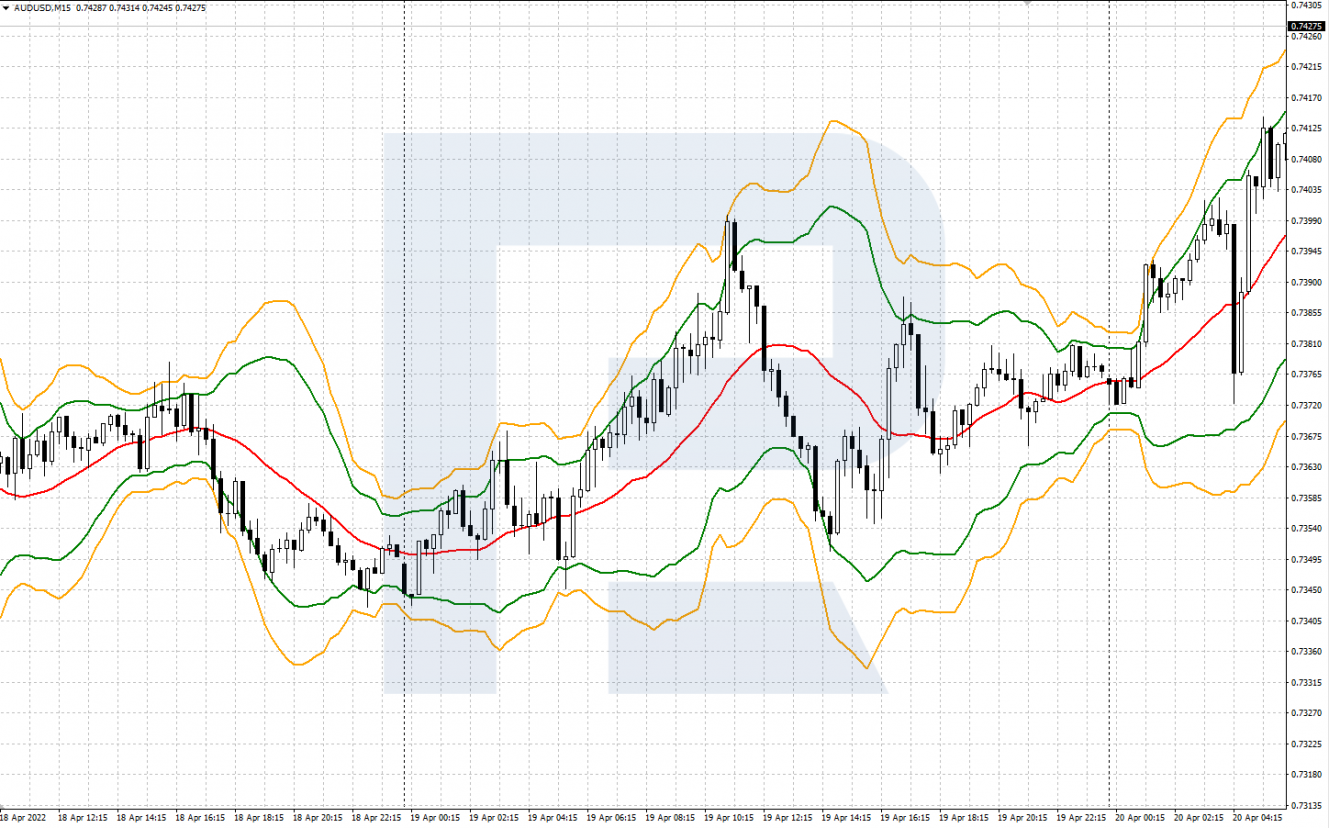
STDev can be used for trading on its own and alongside other indicators. Also, it is used inside more complicated indicators. For example, it can be found in a famous channel indicator Bollinger Bands: STDev helps to calculate the borders of the price range for the quotes.
Standard Deviation appears in a separate window under the chart and has just one main line. Its values start with 0 and always remain positive, i.e. never drop under 0.
The indicator does not show trend direction. The line will grow alongside the growth of volatility regardless of the market direction, equally when the quotes are growing and falling.
How to install Standard Deviation
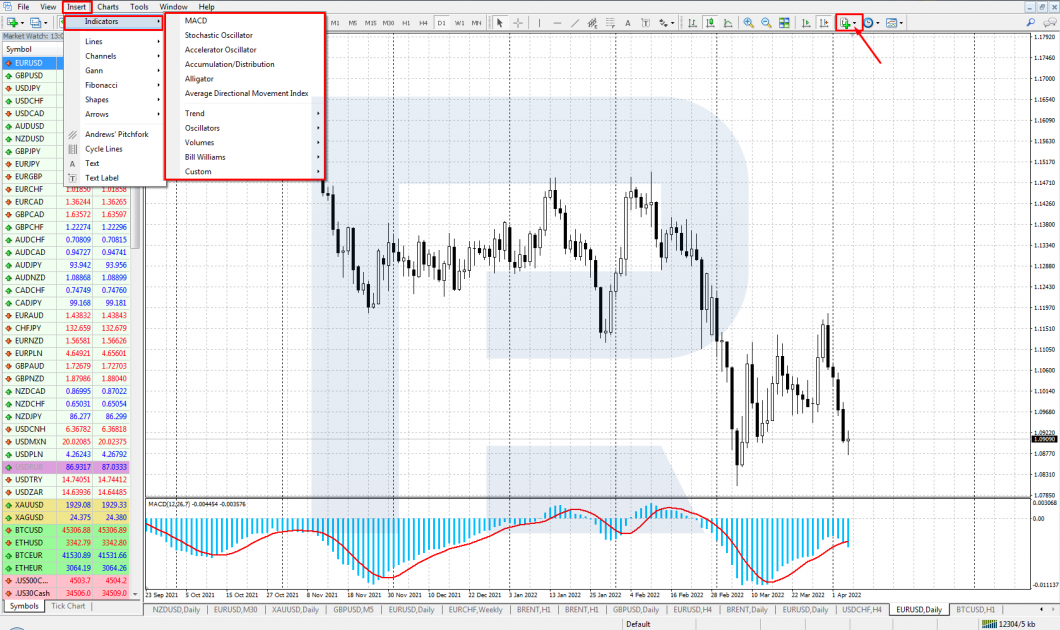
Standard Deviation is built in the majority of popular trading platforms. To install it on the chosen price chart on the MetaTrader 4 and MetaTrader 5 platforms, go to the Main Menu. Your algorithm is: Main Menu – Insert – Indicators – Trend – Standard Deviation.
You can customize the following settings:
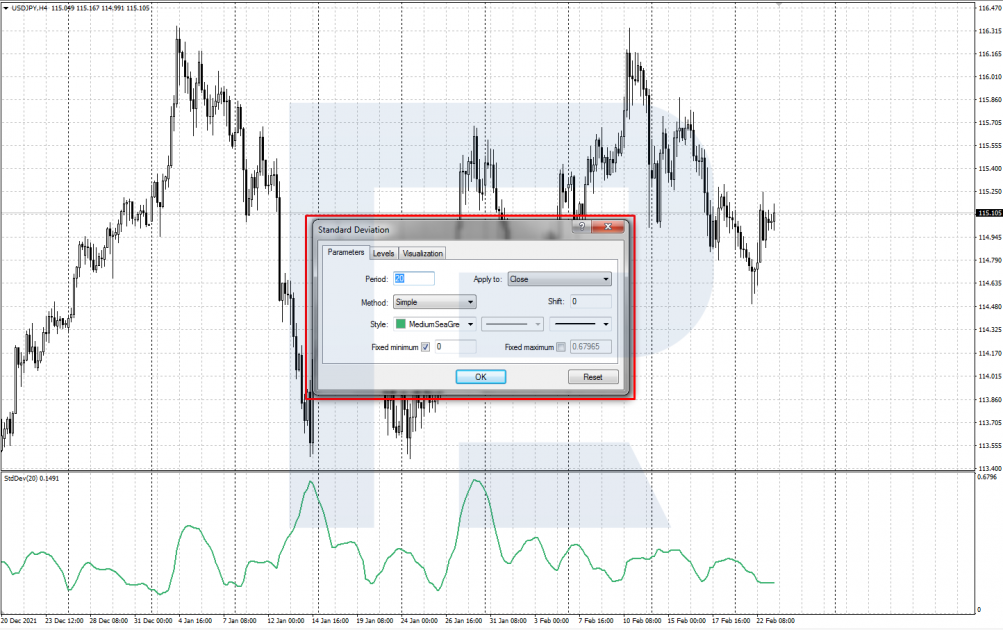
Calculating Standard Deviation
To calculate the indicator, use the following formula of statistic average square deviation:
Standard Deviation = Sqrt (SUM ((CLOSE - SMA (CLOSE, N)) ^ 2, N) /N)
Where:
Read more at R Blog - RoboForex
Sincerely,
RoboForex team
Author: Victor Gryazin

Dear Clients and Partners,
Today the article is devoted to the Standard Deviation indicator. It helps evaluate the dynamics of volatility of a financial instrument and find promising entry points.
What the indicator shows
Standard Deviation (STDev) is a trading instrument that shows how far the price of a financial instrument deviates from standard values of a certain period. It shows the deviation from a Simple Moving Average and thus helps to assess the change in the price volatility.
The indicator conditionally belongs to trend ones: when it grows, this might mean the beginning of a new market trend. The higher the volatility and the more the price fluctuates from the average over the chosen period, the higher STDev values will be. And vice versa: if the quotes are stable, trading in a narrow price range, indicator values will fall to the lows.
STDev can be used for trading on its own and alongside other indicators. Also, it is used inside more complicated indicators. For example, it can be found in a famous channel indicator Bollinger Bands: STDev helps to calculate the borders of the price range for the quotes.
Standard Deviation appears in a separate window under the chart and has just one main line. Its values start with 0 and always remain positive, i.e. never drop under 0.
The indicator does not show trend direction. The line will grow alongside the growth of volatility regardless of the market direction, equally when the quotes are growing and falling.

How to install Standard Deviation
Standard Deviation is built in the majority of popular trading platforms. To install it on the chosen price chart on the MetaTrader 4 and MetaTrader 5 platforms, go to the Main Menu. Your algorithm is: Main Menu – Insert – Indicators – Trend – Standard Deviation.
You can customize the following settings:
- Period is the period for which the indicator will be calculated. By default, it is 20.
- Apply to: choose the price that calculations will be based on. By default, it is Close.
- MA method is the calculation method for the MA. By default, it is Simple.
- Style sets the appearance of the line. You can change its color, width, and representation method.

Calculating Standard Deviation
To calculate the indicator, use the following formula of statistic average square deviation:
Standard Deviation = Sqrt (SUM ((CLOSE - SMA (CLOSE, N)) ^ 2, N) /N)
Where:
Read more at R Blog - RoboForex
Sincerely,
RoboForex team


