What's new

General About FXOpen – FXOpen.com

4.40 star(s) 7 Votes
EUR/USD Extends Decline, USD/CHF Gains Momentum


EUR/USD started a fresh decline from well above the 1.1350 pivot zone. USD/CHF is rising, and it might extend gains above the 0.9350 level.

Important Takeaways for EUR/USD and USD/CHF


  • The Euro failed to gain strength and declined below 1.1300 against the US Dollar.
  • There is a key bearish trend line forming with resistance near 1.1255 on the hourly chart of EUR/USD.
  • USD/CHF started a decent increase from the 0.9250 support zone.
  • There is a connecting bullish trend line forming with support near 0.9310 on the hourly chart.

EUR/USD Technical Analysis

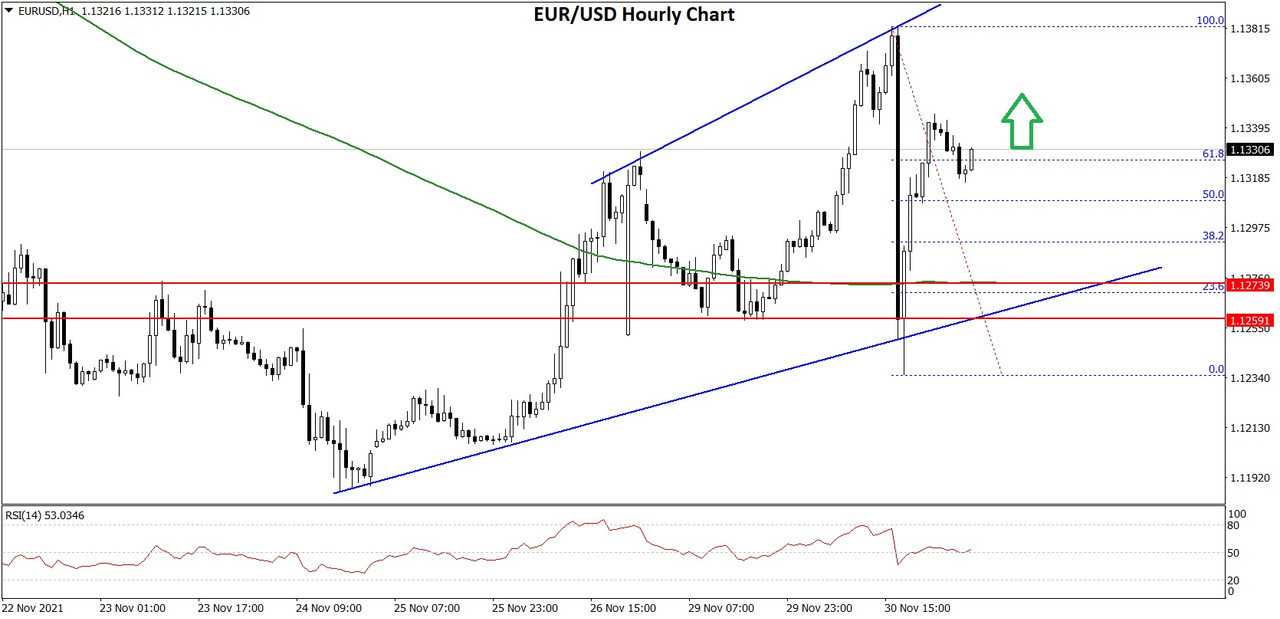
The Euro attempted an upside break above the 1.1400 resistance zone against the US Dollar. The EUR/USD pair failed to gain strength and started a fresh decline.

There was a clear break below the 1.1350 and 1.1300 support levels. The pair even broke the 1.1250 support and the 50 hourly simple moving average. Finally, there was a move below the 1.1230 level and a low is formed near 1.1226 on FXOpen.

EUR/USD Hourly Chart
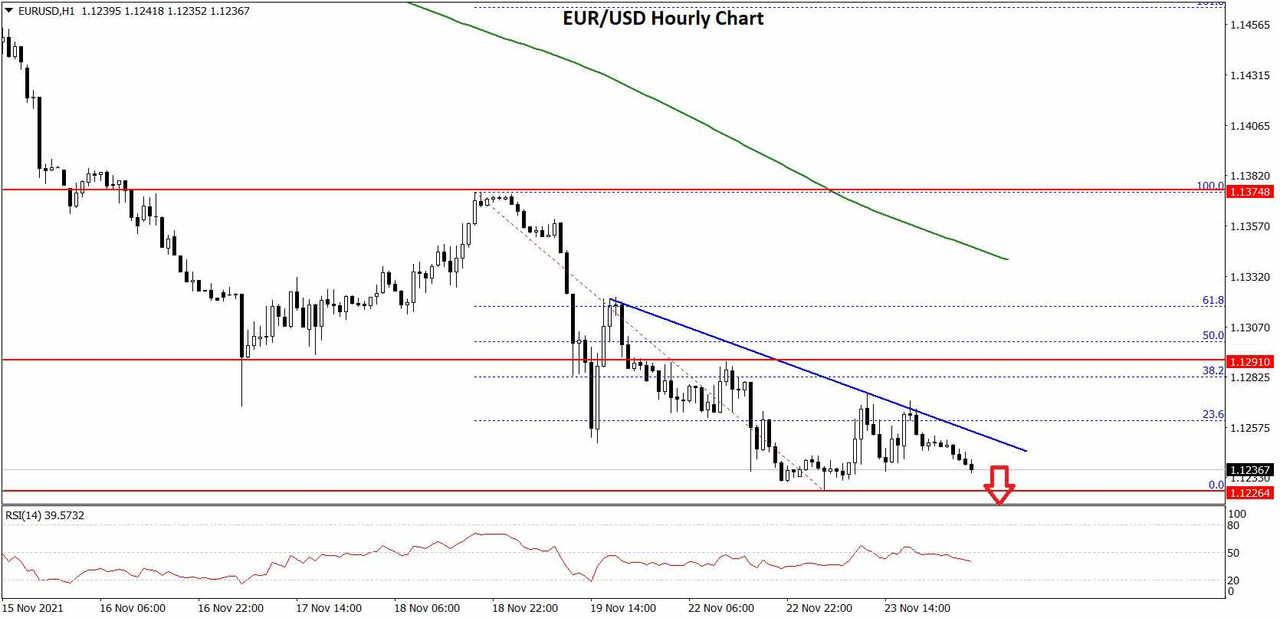

The pair is now consolidating losses near the 1.1230 level. On the upside, an initial resistance is near the 1.1255 level. The 23.6% Fib retracement level of the recent decline from the 1.1373 swing high to 1.1226 low is also near 1.1255.

There is also a key bearish trend line forming with resistance near 1.1255 on the hourly chart of EUR/USD. The next major resistance is near the 1.1300 zone.

The 50% Fib retracement level of the recent decline from the 1.1373 swing high to 1.1226 low is also near the 1.1300 zone. A clear upside break above the 1.1300 zone could open the doors for a steady move.

The next major resistance sits near the 1.1350 level. On the downside, an immediate support is near the 1.1225 level. The next major support is near the 1.1200 level.

A downside break below the 1.1200 support could start another decline. The next major support sits near 1.1120.

Read Full on FXOpen Company Blog...
 
BTCUSD and XRPUSD Technical Analysis – 23rd NOV, 2021


BTCUSD: Head and Shoulders Pattern Below $60,000

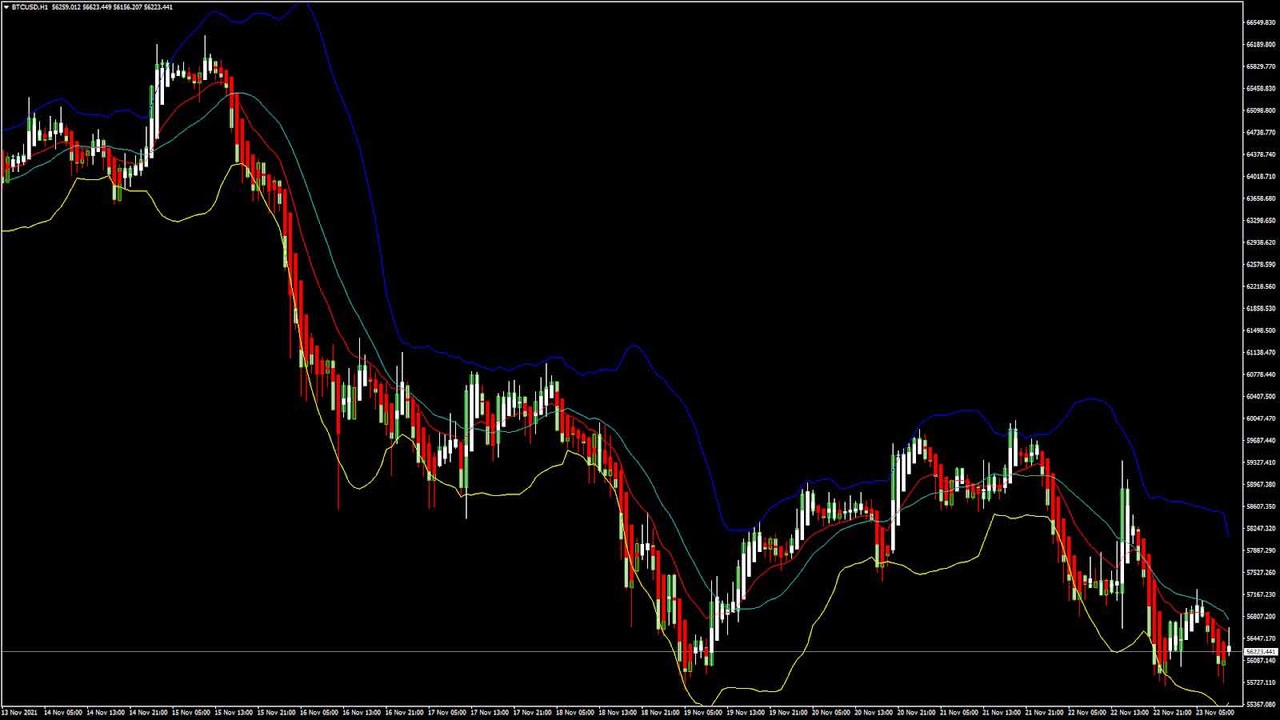
Bitcoin is moving in continuation of a strong bearish trend this week, and any attempts towards a bullish reversal failed. This is the reason we see BTCUSD trading below the $60,000 handle in the European trading session today.

We can clearly see a head-and-shoulders pattern below the $60,000 level which signifies that we are in a confirmed downtrend.

Yesterday, we saw yesterday BTCUSD touching an intraday high of $59,965 after which the prices started to decline and touched an intraday low of $55,676, with today’s intraday low of $55,864.

We can see a continuous downwards selling pressure in bitcoin today, and more losses are expected in the coming days.

The immediate short-term outlook for bitcoin turned bearish, and now we are looking at levels of $55,000 and $52,000.

Williams percent range is overbought which signifies that more selling is expected today in the US trading session which will push the prices of BTCUSD below the $55,000 handle.

Bitcoin is now moving below both the 100 hourly simple and exponential moving averages.

The average true range is indicating less market volatility which means that markets are due to enter a consolidation phase soon.

  • Bitcoin’s downtrend continues aiming for downsides below $55,000
  • Stoch is indicating OVERBOUGHT levels
  • The price is now trading just below its pivot level of $56,080
  • All moving averages are giving a STRONG SELL signal at current market levels of $56,278

Bitcoin: Strong Bearish Trend Towards $55,000


BTCUSD has already broken its support level of $56,500 and is now about to break its important psychological support level of $55,000.

The price of BTCUSD is trading above its classic support level of $55,242 and Fibonacci support level of $55,874 in the European trading session.

In the last 24hrs, BTCUSD has gone DOWN by -2.21% with a price change of -1271$ and has a 24hr trading volume of USD 35.677 billion.

Bitcoin Bonds

El Salvador has become the first country to issue a $1 billion bitcoin bond with a 10-year maturity on the Liquid Network.

The new bitcoin-linked bond appears to be the highest-yielding fixed income instrument globally. This bond will yield a 6.5% rate of annual interest payments to its investors.

The credit rating for this bitcoin bond is negative due to the distressed-debt situation of El Salvador.

El Salvador adopted bitcoin as legal tender in June 2021, after which Moody's Investors Service downgraded the long-term foreign-currency issuer and senior unsecured ratings to Caa1 from B3.

The Week Ahead

The downward selling pressure seen in Bitcoin is expected to push its prices to the $52,000 range, after which a fresh wave of consolidation and an uptrend move is expected.

The bearish trend formation continues and is expected to push the prices below the level of $54,000 this week. After touching a low of $52,000, a potential bullish trend reversal is expected for which we will have to wait until next week.

The prices will need to remain above the important support level of $52,682 for a bullish reversal of the markets.

Technical Indicators:

Relative strength index (14-day): at 35.28 indicating a SELL

Average directional change (14-day): at 40.639 indicating a SELL

Moving averages convergence divergence (12,26): at -442.90 indicating a SELL

Ultimate oscillator: at 40.127 indicating a SELL

Read Full on FXOpen Company Blog...
 
ETHUSD and LTCUSD Technical Analysis – 25th NOV, 2021


ETHUSD: Double Bottom Pattern Above $4,000

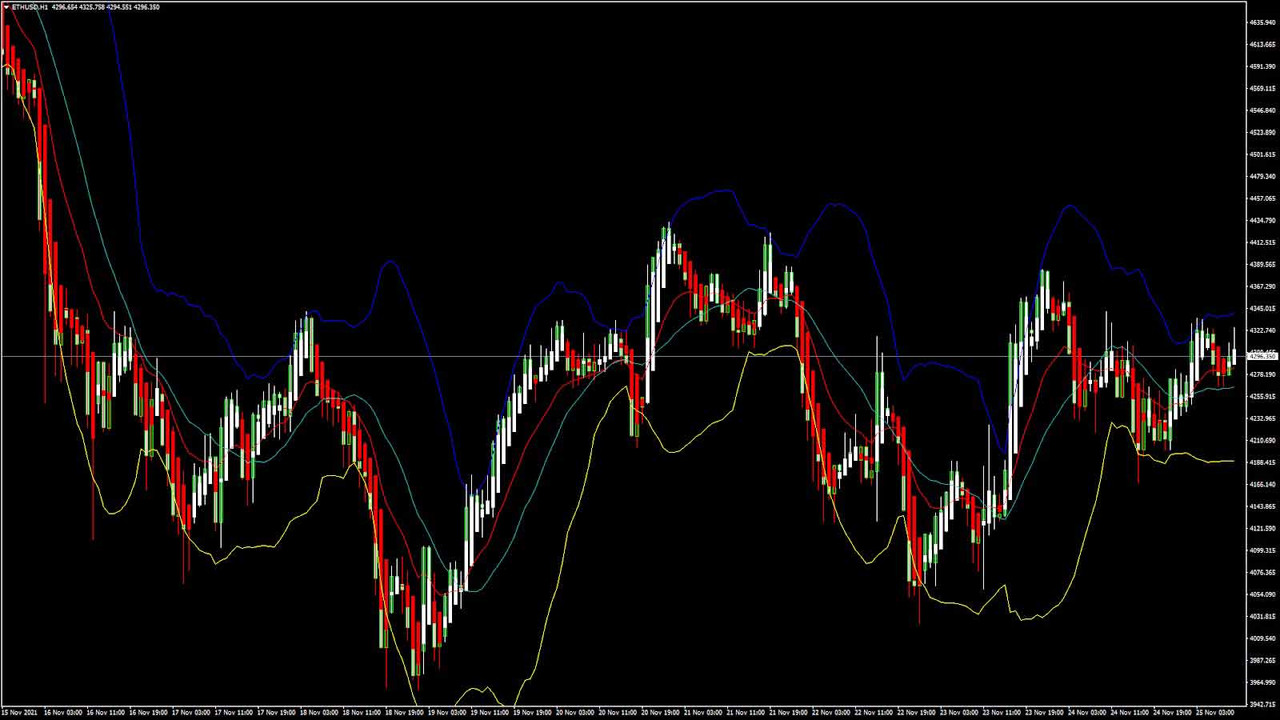
On Nov 23rd, Ethereum touched a low of $4,030, after which the prices stabilized and, as of yesterday, entered into a consolidation phase.

In today’s Asian trading session, ETHUSD touched an intraday high of $4,334.

We can see a double bottom pattern above $4,000 which signifies a bullish reversal, end of a downtrend and a shift towards an uptrend.

In today’s European trading session, the price of Ethereum continues to rise slowly and is aiming for upsides of $4,400 and $4,500.

The fall in the levels of ETH seen last week occurred due to profit-taking; the bullish tone is back in the markets. The pair is gaining a bullish momentum and is also poised for a rally upwards of $4,500 that can happen any time now.

ETH is trading above its pivot level of $4,276 and moving in a bullish trend. The price of ETHUSD has already broken its classic resistance level of $4,298 and its Fibonacci resistance level of $4,290. In the US trading session, it is aiming towards the $4,400 handle.

All the major technical indicators are giving a STRONG BUY signal.

ETH is now trading above both the 100 hourly and 200 hourly simple moving averages.

  • Ethereum is in continuation of bullish channel
  • Short-term range appears to be bullish for ETHUSD
  • All the moving averages are giving a STRONG BUY signal
  • Average true range is indicating LESS market volatility

Ether: Bullish Trend Towards $4,500 Confirmed


ETHUSD was moving in a consolidation channel in the early Asian trading session today after which a bullish momentum started pushing the price above the $4,300 handle.

We can see that last week’s heavy-selling pressure has exhausted, and now buyers are returning to the markets.

The relative strength index is NEUTRAL which signifies a potential trend reversal today.

It is best to enter into long positions in Ethereum at the present market level of $4,300 with targets of $5,000 the next month.

The average true range is indicating low market volatility as we can see a 12% drop in the trading volume as compared to yesterday. This is because the market was in a consolidation phase and the buyers were waiting for a bullish pattern which is clearly visible now.

ETH has gained +0.63% with a price change of +26.94$ in the past 24hrs and has a trading volume of 18.729 billion USD.

The Week Ahead

Ether is printing above $4,300 today, and we could see $4,500 this week.

The medium-to-long term outlook for Ether remains bullish, targeting $5,000 and above in the next month.

We can already see an increase in Ethereum’s market capitalization which currently stands at $510 billion.

The price of ETHUSD has already broken its key resistance level of $4,270 and is about to break its next resistance level of $4,335.

We could see Ether printing at above $4,500 next week and aim upsides towards the $5,000 handle.

At present, the market is offering a good buying opportunity for long-term traders who can hold till it reaches $10,000 in 2022.

Technical Indicators:

The commodity channel index (14-day): at 56.55 indicating a BUY

Moving averages convergence divergence (14-day): at 11.85 indicating a BUY

StochRSI (14-day): at 69.83 indicating a BUY

Rate of price change: at 2.121 indicating a BUY

Read Full on FXOpen Company Blog...
 
AUD/USD and NZD/USD Turn Red, Risk of More Losses


AUD/USD started a fresh decline from well above 0.7250. NZD/USD is also declining, and it might accelerate lower below the 0.6800 level.

Important Takeaways for AUD/USD and NZD/USD


  • The Aussie Dollar started a major decline from the 0.7300 resistance against the US Dollar.
  • There was a break below a connecting support trend line at 0.7170 on the hourly chart of AUD/USD.
  • NZD/USD also started a major decline from well above the 0.7000 level.
  • There is a key bearish trend line forming with resistance near 0.6855 on the hourly chart of NZD/USD.

AUD/USD Technical Analysis

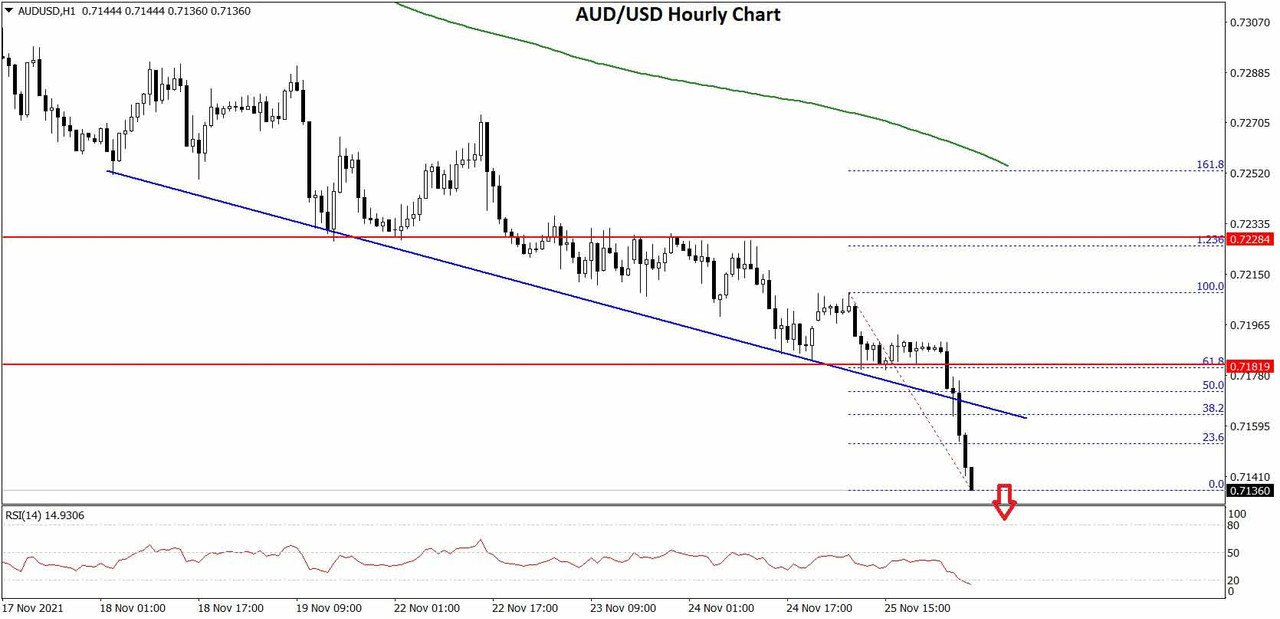
The Aussie Dollar started a major decline after it failed to clear 0.7300 against the US Dollar. The AUD/USD pair traded below the 0.7250 and 0.7200 support levels to move into a bearish zone.

The pair even broke the 0.7150 support and the 50 hourly simple moving average. Besides, there was a break below a connecting support trend line at 0.7170 on the hourly chart of AUD/USD. The pair is now accelerating lower below the 0.7150 level.

AUD/USD Hourly Chart


An initial support on the downside is near the 0.7120 level. The next major support is near the 0.7100 level. If there is a downside break below the 0.7100 support, the pair could extend its decline towards the 0.7050 level.

On the upside, an immediate resistance is near the 0.7150 level. It is near the 23.6% Fib retracement level of the recent decline from the 0.7208 swing high (formed on FXOpen) to 0.7136 low.

The next major resistance is near the 0.7175 level. It is near the 50% Fib retracement level of the recent decline from the 0.7208 swing high to 0.7136 low. A close above the 0.7175 level could start a steady increase in the near term. The next major resistance could be 0.7250.

Read Full on FXOpen Company Blog...
 
Spreads Comparison

FXOpen offers competitive spreads for each account type. FXOpen STP accounts offer tight spread, while ECN accounts offer raw spreads.


Please visit our official website and gets latest updates about each account types.
 
GBP/USD Faces Hurdle, USD/CAD Remains In Uptrend


GBP/USD is attempting a recovery wave from the 1.3280 zone. USD/CAD is rising and is showing positive signs above the 1.2700 support.

Important Takeaways for GBP/USD and USD/CAD


  • The British Pound found support near 1.3280 and started an upside correction.
  • There was a break above a key bearish trend line with resistance near 1.3330 on the hourly chart of GBP/USD.
  • USD/CAD started a major increase above the 1.2650 and 1.2700 resistance levels.
  • There is a crucial rising channel forming with support near 1.2685 on the hourly chart.

GBP/USD Technical Analysis

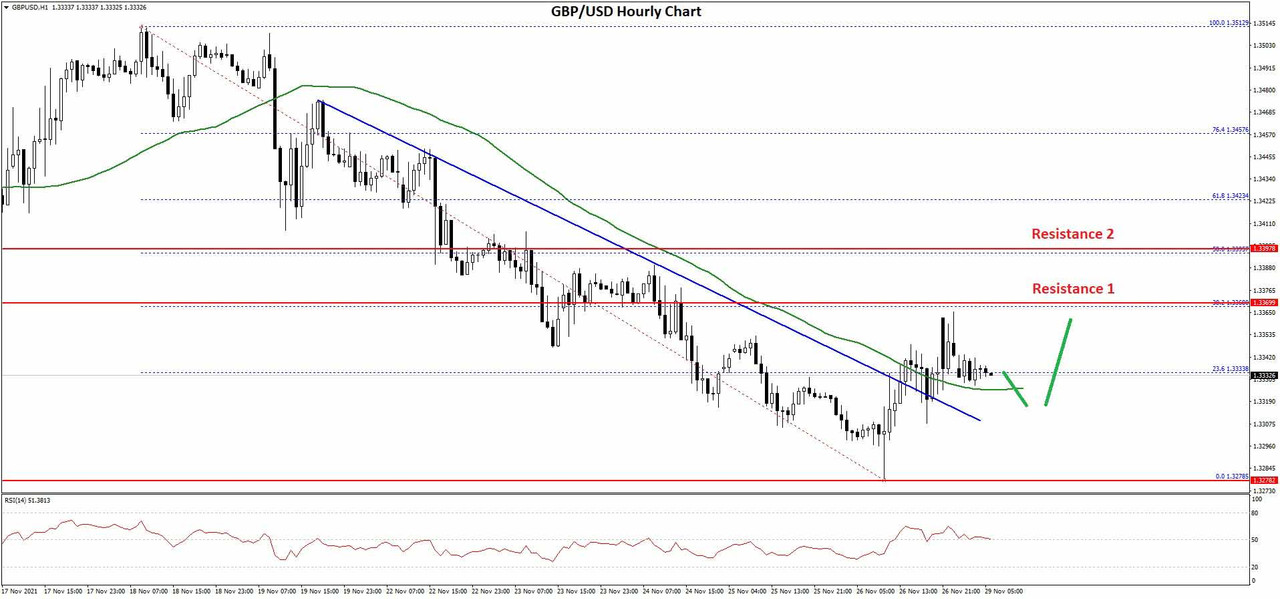
After a major decline, the British Pound found support above 1.3250 against the US Dollar. GBP/USD traded as low as 1.3278 on FXOpen and recently started an upside correction.

The pair broke the 1.3320 resistance to move into a short-term positive zone. There was a break above the 23.6% Fib retracement level of the downward move from the 1.3512 swing high to 1.3278 low. Besides, there a break above a key bearish trend line with resistance near 1.3330 on the hourly chart of GBP/USD.

GBP/USD Hourly Chart


It is now trading above the 1.3330 level and the 50 hourly simple moving average. An immediate resistance is near the 1.3370 level.

The first major resistance is near the 1.3400 level. It is near the 50% Fib retracement level of the downward move from the 1.3512 swing high to 1.3278 low. If there is an upside break above the 1.3400 zone, the pair could rise towards 1.3500.

The next key resistance could be 1.3550, above which the pair could gain strength. On the downside, the first key support is near the 1.3320 area.

If there is a break below 1.3320, the pair could decline extend its decline. The next key support is near the 1.3280 level. Any more losses might call for a test of the 1.3200 support.

Read Full on FXOpen Company Blog...
 
BTCUSD and XRPUSD Technical Analysis – 30th NOV, 2021


BTCUSD: Double Bottom Pattern Above $53,000

Bitcoin suffered heavy losses at the end of last week when it touched a low of $53,700 and remained in the bearish trend.

At the start of this week, bitcoin had a major bullish correction after it recovered from its last-week losses and gained more than 6%, touching the $57,000 handle.

This week, bitcoin is moving in continuation of a mild bullish trend and giving mixed signals. At present, BTCUSD is trading above the $56,000 handle in the European trading session.

We can clearly see a double bottom pattern above the $53,000 handle, which is a bullish reversal pattern signifying the end of the downtrend and a shift towards an uptrend.

Yesterday, we saw BTCUSD touching an intraday high of $57,635 after which the prices started to decline and, today, touched an intraday low of $56,795.

The immediate short-term outlook for bitcoin has turned NEUTRAL and we will have to wait till the clear market signals are visible.

Williams percent range is overbought which signifies that more selling is expected today in the US trading session, pushing the prices of BTCUSD below the $56,000 handle.

Bitcoin is now moving above its 100 hourly simple and exponential moving averages.

The average true range is indicating less market volatility which means that markets are due to enter into a consolidation phase soon.

  • Bitcoin trend reversal is seen above $53,000
  • Stoch is indicating OVERBOUGHT levels
  • The price is now trading just below its pivot level of $57,213
  • All the moving averages are giving a NEUTRAL signal at current market level of $56,820

Bitcoin’s Mild Bullish Trend Towards $58,000


BTCUSD is now trading above its important support level of $56,500 and needs to remain above this level for the bullish trend to continue today.

Some of the major technical indicators are giving a STRONG SELL signal, which means that the prices can also get a downward correction before reaching the level of $60,000.

The price of BTCUSD is trading below its classic resistance level of $57,363 and Fibonacci resistance level of $57,478 in the European trading session.

In the last 24hrs BTCUSD has gone DOWN by -1.19% with a price change of -682$ and has a 24hr trading volume of USD 31.536 billion. We can see an increase of 7.64% in the trading volume as compared to yesterday.

The Week Ahead

We can see that bitcoin has recovered from its losses and is on its way towards the $58,000 handle this week.

The medium to long term outlook remains BULLISH for bitcoin with the target of $65,000. At present, the markets are giving a SELL signal so it would be better to wait before entering the long positions in bitcoin.

The relative strength index of 46 is indicating a NEUTRAL market and fresh buying is expected in the market at any time.

It is also possible for bitcoin to remain in a sub-consolidation phase below the $57,000 handle this week and start its bullish move next week.

Technical Indicators:

Stoch (9,6): at 97.13 indicating an OVERBOUGHT level

Average directional change (14-day): at 30.35 indicating a SELL

Rate of price change: at -0.288 indicating a SELL

Ultimate oscillator: at 39.55 indicating a SELL

Read Full on FXOpen Company Blog...
 
EUR/USD Starts Fresh Increase, USD/JPY Bears Remain In Action


EUR/USD started a fresh increase above the 1.1300 resistance. USD/JPY is declining and might accelerate lower below the 113.00 support.

Important Takeaways for EUR/USD and USD/JPY


  • The Euro started a steady increase above the 1.1280 and 1.1300 resistance levels.
  • There is a major bullish trend line forming with support near 1.1270 on the hourly chart of EUR/USD.
  • USD/JPY started a fresh decline from well above the 114.50 level.

EUR/USD Technical Analysis

This week, the Euro started a steady increase above the 1.1280 resistance against the US Dollar. The EUR/USD pair gained pace for a move above the 1.1300 resistance.

The pair even broke the 1.1320 level and settled above the 50 hourly simple moving average. A high was formed near 1.1382 and there was a downside correction. A low was formed near 1.1235 on FXOpen and the pair is now rising.

EUR/USD Hourly Chart


It broke the 50% Fib retracement level of the recent decline from the 1.1382 swing high to 1.1235 low. An immediate resistance on the upside is near the 1.1340 level.

The next major resistance is near the 1.1360 level. It is near the 76.4% Fib retracement level of the recent decline from the 1.1382 swing high to 1.1235 low. The main resistance is near the 1.1380 level, above which the pair could accelerate higher.

If there is no break above 1.1360, the pair might start a downside correction. An immediate support is near the 1.1280. The next major support is near 1.1270.

There is also a major bullish trend line forming with support near 1.1270 on the hourly chart of EUR/USD. Any more losses might push the EUR/USD pair towards the 1.1220 support in the near term.

Read Full on FXOpen Company Blog...
 
Global Share Price Growth Across the Decade

A Comparison of Global Companies Share price since 2011


Here at FXOpen, we are interested in the volatility of the stock market and our online share trading account provides clients with the opportunity to trade equity CFDs. Using CFD trading is a different way to invest in shares, as you don’t become the owner of the shares but take a position on whether the price will go up or down, speculating on the future share price of the company.

We have compared how some of the major global companies share price has changed over the past decade.

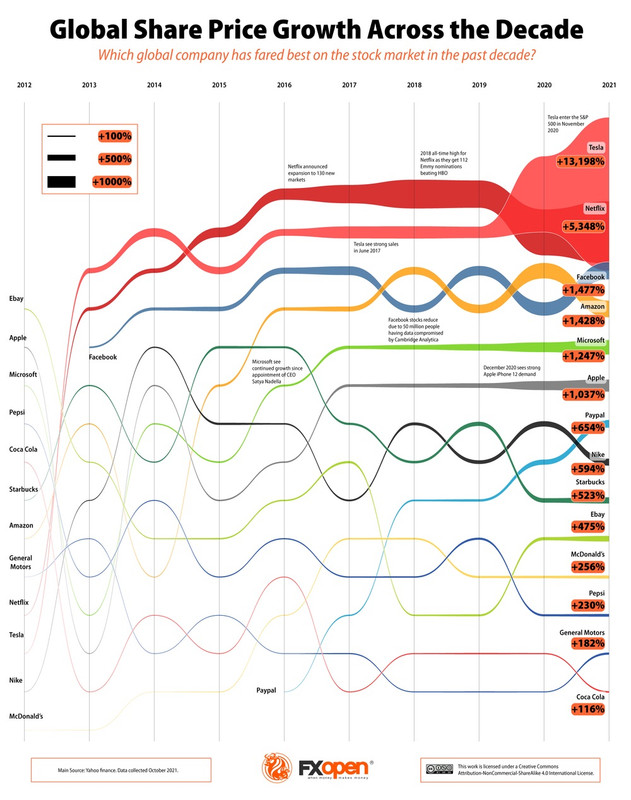
To demonstrate our findings, we have created an infographic which shows the percentage share increases of some of the world’s biggest companies in the last ten years and how they have compared against one another.


Tesla tops growth over the past decade

In 2012 Tesla’s yearly percentage growth was minus 4%, yet the ten years since have told a completely different story, with their overall percentage increase since 2011 standing at 13,198%. Over double the growth of Netflix who sat second in the global companies we analysed.

The appetite for electric car models has increased in the past decade and that correlates with the rise in Tesla’s share price. Periods of strong sales and reviews have increased the share price over the last ten years.

The automotive company has seen huge rises in their share price since 2019. October 1st 2019 saw their share price at $62.98, while the same period in 2021 it had rise to $780.59, again due to strong sales and the entering of the S&P 500 in late 2020.

Netflix sees huge share price increase

Similar to Tesla, Netflix yearly growth from 2011-2012 was minus 3% but their share price has been soaring ever since, with the share price percentage increasing by over 5000% since 2011.

Due to international expansion in 2012 to Europe and a further 130 new markets in 2016, the subscription numbers have risen dramatically, with this year Netflix hitting 214 million subscribers, nearly ten times the subscribers they had in 2011.

Alongside global expansion, the streaming service started making their original content from 2012 which has been ever present in recent years and in 2012 for the first time they beat HBO as they received 112 Emmy nominations.

Netflix growth on the stock market dominated the other global companies we analysed, as it was the most successful company on the S&P 500 pre 2020. It has only been the past two years where Tesla share price growth levels have surpassed Netflix’s.

Technology giants see strong growth

In the past decade, Apple, Microsoft and Amazon have all seen impressive share price growth of over 1000% since 2011.

Since 2011 Amazon’s share price has seen the highest percentage growth out of the three global technology companies, with an increase of over 1400%. The mammoth growth shown by Amazon is largely due to the popularity of Amazon Prime, their subscription service which saw a huge increase in the pandemic due to consumers having to stay at home.

Microsoft (+1247%) and Apple (+1037%) have both seen their share price increase consistently in the past ten years. Microsoft have seen continued large scale growth on the stock market since the appointment of CEO Satya Nadella in 2014.

Apple share price is largely impacted due to their product demand. Their share price rose in 2015 as a result of the large iPhone screens success while recently they have seen a rise in their share price due to the strong demand of their iPhone 12 at the end of 2020.

Facebook shows huge returns in first decade on the stock market

Since Facebook went public in 2012, the world’s largest social media firm has seen massive growth in their share price. Initially going public at a share price of $38, by 2021 that had increased to over $300, giving an increase of 1477%.

Facebook shares have seen consistent strong growth owing to the increase numbers of active users and the aggressive growth strategy through acquisitions such as Instagram in 2012 and WhatsApp in 2014. Facebook’s growth in the past decade is significantly higher than its closest competitors, with Twitter’s share price actually decreasing by 4% over that time.

The social media company has had some dips during their time on the stock market so far, in particular in 2018 when 50 million people had their data compromised by Cambridge Analytica.

Pepsi v Coca Cola

Pepsi-Co and Coca Cola Corporation have been competitors in the non-alcoholic beverage industry for many years. But how does the share price of the two powerhouses compare?

Over the past ten years, the share price of Pepsi-Co has increased by 230%. This is nearly double the 116% increase that Coca Cola has seen since 2011. Both brands had a similar yearly percentage increase in 2012 but since then, the Pepsi-Co share price has seen greater increases than Coca-Cola.

All the global companies on the stock market that we have analysed have seen over 100% growth since 2011 but Tesla and Netflix lead the way with colossal share price increases in the last decade. However, over the past ten years the share price of global companies has shown volatility due to the demand for shares relying on various factors such as company success, news stories and wider economic trends.

FXOpen Blog
 
Stock CFD trading thwarted by exit of energy and utility companies? Not today!


The past few months have proven very uncertain for a large percentage of the British public as a very unusual circumstance took the energy and utilities market by storm.

Since the summer of 2021, over 20 energy and utilities companies have exited the British market, many of which have gone bankrupt due to the rising cost of oil and gas and the inability of these companies to be able to pass that cost on to their customers.

This has created what is being described as a 'cost of living crisis' as the remaining large energy providers have now been left to onboard those whose services have ended, meaning that bills have gone up for a large percentage of the UK population.

Some of the now defunct energy companies were privately held, however some had their stock publicly listed on the London Stock Exchange, meaning that they were sizeable entities in their own right.

It would therefore be quite understandable for investors and traders to shy away from utilities or energy company stocks at this point in time, especially given the ultra-conservative approach many firms have taken in trying to absorb some of the increased logistical, supply chain and raw materials cost themselves in order to avoid passing it onto customers who are already cash-strapped and therefore could end up getting into debt with their bills, that energy companies may well be not in favour.

Actually, that is not quite the case, as United Utilities PLC, a large British water company, is experiencing a steady increase in investor confidence.

Its value was relatively flat during November, however all of a sudden at the end of the month United Utilities stock began to rise going from £10.94 per share on November 17 to £10.95 by November 26.

Suddenly, the price dropped on December 1, but this morning it has risen once again and recovered very quickly shortly after the opening bell at the London trading session.

Currently, United Utilities is trading at £10.90 per share which is 0.6% up on yesterday, and 1.35% over the weekly moving average.

Whilst these do not necessarily sound like large movements, they are for a utilities company at this particular time, and the trendline that shows investor confidence with steady upward growth with a minor blip of downward volatility yesterday which was very quickly recovered.

Therefore, United Utilities performance on the London market is perhaps a breath of fresh air to traders who have previously enjoyed the blue chip, evergreen nature of utility companies and have recently had their plans thwarted by the exit of many energy firms from the market.

Going with the flow has certainly a double meaning on this occasion!

FXOpen Blog
 
ETHUSD and LTCUSD Technical Analysis – 02nd DEC, 2021


ETHUSD: Bullish Engulfing Pattern Above $4,400

Ethereum had a major bearish correction last week when it declined towards the $4,000 handle after touching a high of $4,551.

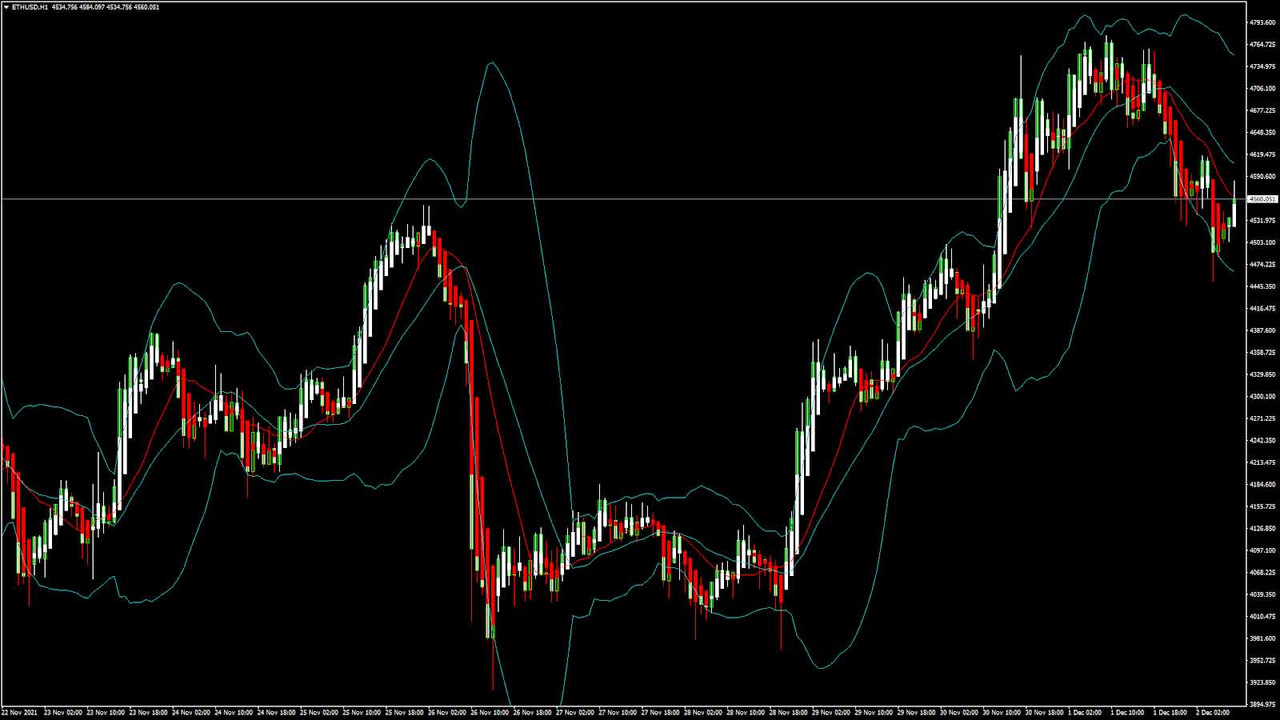
ETHUSD started this week in a consolidation phase after which it had a bullish reversal towards $4,700 and touched an intraday high of $4,776 in today’s Asian trading session.

We can clearly see a bullish engulfing pattern above $4,400 which signifies a trend reversal, and ETHUSD crossing $4,700.

Ethereum price has retracted from its highs due to some profit-taking, but the bullish channel continues, and this week, we are aiming for the upsides of $4,700 and $4,900.

ETH is now trading above its pivot level of $4,524 and moving in a mild bullish momentum. The price of ETHUSD has already broken its classic resistance level of $4,545, its Fibonacci resistance level of $4,555, and is now aiming towards the $4,600 handle in the US trading session.

Moving averages are giving a NEUTRAL signal.

ETH is now trading above both its 100 hourly and 200 hourly simple moving averages.

  • Ethereum is in a mild bullish channel
  • Short-term trend reversal seen above $4,400
  • All the major technical Indicators are giving NEUTRAL to SELL signals
  • Average true range is indicating LESS market volatility

Ether: Bullish Channel Towards $4,900 Confirmed


ETHUSD is consolidating its gains above $4,500 in the European trading session and we can clearly see that the bullish channel is back.

We are now aiming for the upsides of $4,600 to $4,700 in today’s US trading session. The retracement from $4,000 was very strong, which suggests that there is more room for upsides in Ethereum this month, and $5,500 is the next target.

At present, technical indicators are giving a SELL signal which means that in the immediate short-term we will see a decline before the continuation of a bullish channel.

ETH has declined by -4.26% with a price change of -202.85$ in the past 24hrs and has a trading volume of 26.670 billion USD.

We can see a decrease of 11% in the trading volume as compared to yesterday, which means that new buyers are not entering the markets and waiting for further correction in the levels of Ethereum.

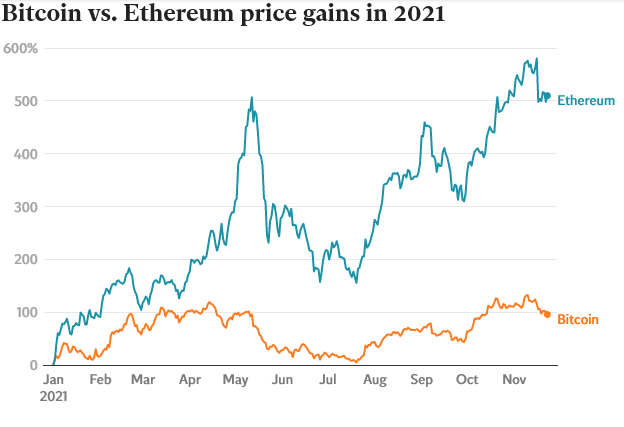
Ethereum Gains in 2021

We have seen the prices of Ethereum increasing continuously throughout 2021. Starting from $730 on 1st Jan 2021, Ether is currently trading at $4,568, yielding a gain of 625% to its investors — more than Bitcoin during the same period of time.

Ethereum’s performance in 2021 is commendable. The current market valuation of this second-largest cryptocurrency stands at 540.52 billon USD.

A number of leading crypto analysts have also predicted that in the next 5 years, Ethereum could outperform bitcoin and become the topmost cryptocurrency in the world.

The Week Ahead

Ether is printing above $4,500 today, and this week, we could $4,700 to $4,900.

The medium to long-term outlook for Ether in December remains bullish with targets of above $5,000.

Ether has already broken its major resistance level of $4,580 and is now facing the next resistance level of $4,800.

Technical Indicators:

Commodity channel index (14-day): indicating a NEUTRAL market

Moving averages convergence divergence (14-day): at -27.11 indicating a SELL

Average directional change (14-day): indicating a NEUTRAL market

Rate of price change: at -2.386 indicating a SELL

Read Full on FXOpen Company Blog...
 
Gold Price and Crude Oil Price Aim Fresh Increase


Gold price is attempting a fresh increase above the $1,780 resistance zone. Crude oil price could gain pace if there is a clear move above the $68.00 level.

Important Takeaways for Gold and Oil


  • Gold price started a fresh decline from well above the $1,800 zone against the US Dollar.
  • There is a key bearish trend line forming with resistance near $1,775 on the hourly chart of gold.
  • Crude oil price declined sharply below $72.00 and $70.00 levels.
  • There was a break above a major declining channel with resistance near $66.50 on the hourly chart of XTI/USD.

Gold Price Technical Analysis

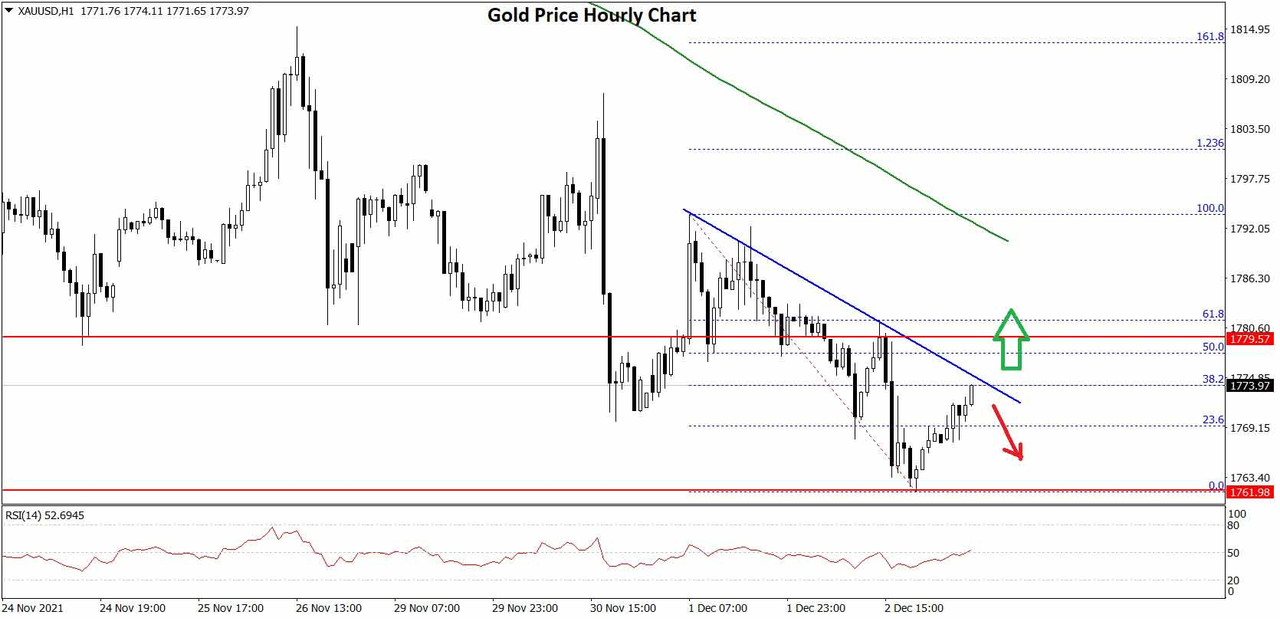
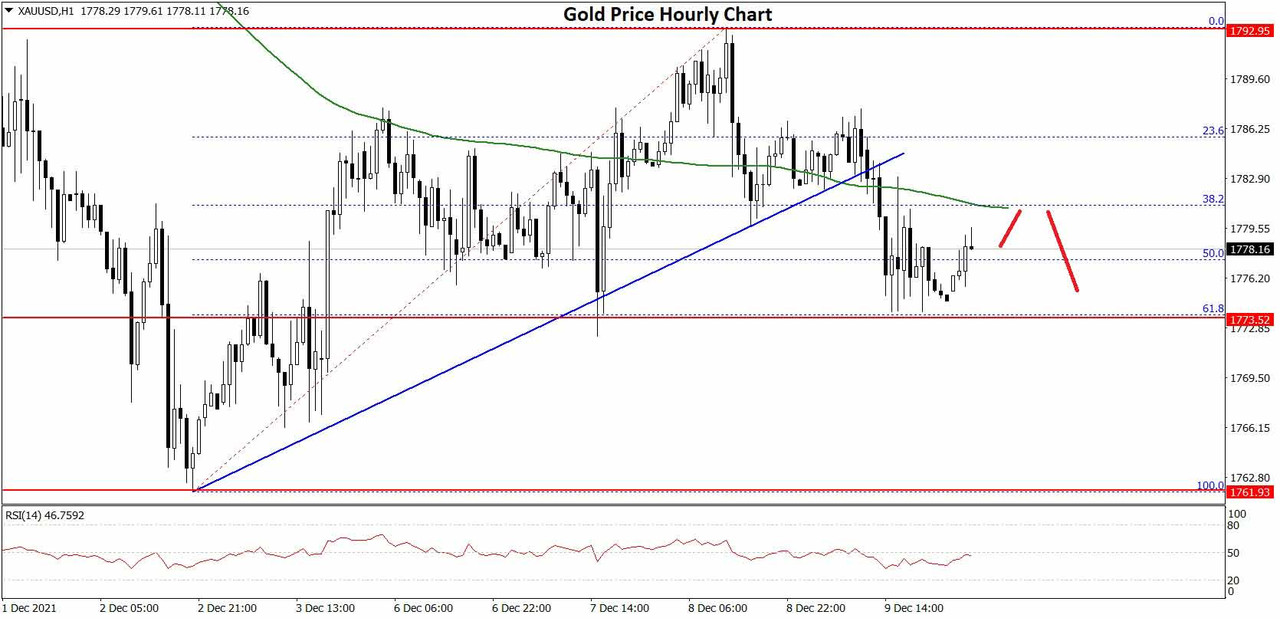
Gold price started a fresh decline from well above the $1,820 pivot level against the US Dollar. The price declined heavily and it even broke the $1,800 support zone.

The price even settled below the $1,800 level and the 50 hourly simple moving average. Finally, there was a break below the $1,780 support zone. A low was formed near $1,761 on FXOpen and the price is now correcting higher.

Gold Price Hourly Chart


There was a recovery wave above the $1,770 level. The price surpassed the 23.6% Fib retracement level of the recent decline from the $1,795 swing high to $1,761 high.

An immediate resistance on the upside is near the $1,775 level. There is also a key bearish trend line forming with resistance near $1,775 on the hourly chart of gold. The next major resistance is near the $1,780 level.

The 50% Fib retracement level of the recent decline from the $1,795 swing high to $1,761 high is also near $1,780. The main resistance is near the $1,800 level. A close above the $1,800 level could open the doors for a steady increase towards $1,820.

The next major resistance sits near the $1,840 level. On the downside, an initial support is near the $1,765 level. The first major support is near the $1,760 level. A downside break below the $1,760 support zone may possibly spark a steady decline. In the stated case, the price could test the $1,720 support.

Read Full on FXOpen Company Blog...
 
GBP/USD and GBP/JPY At Risk of More Downsides


GBP/USD started a fresh decline and traded below the 1.3300 support zone. GBP/JPY is also trading in a bearish zone and is facing hurdles near 150.00.

Important Takeaways for GBP/USD and GBP/JPY


  • The British Pound started a fresh decline after it faced sellers near 1.3360 against the US Dollar.
  • There is a major bearish trend line forming with resistance near 1.3280 on the hourly chart of GBP/USD.
  • GBP/JPY also declined heavily below the 150.00 and 150.00 support levels.
  • There is a key bearish trend line forming with resistance near 150.65 on the hourly chart.

GBP/USD Technical Analysis

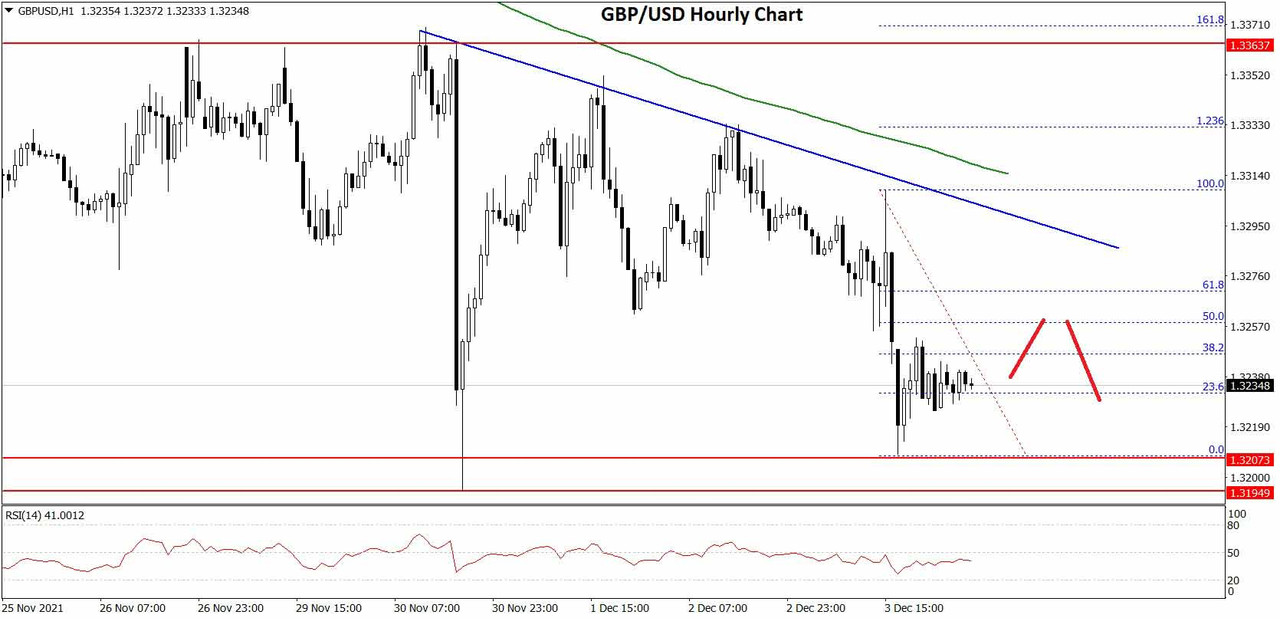
This past week, the British Pound started a fresh decline after it failed near 1.3360 against the US Dollar. The GBP/USD pair broke the 1.3320 and 1.3300 support levels to enter a bearish zone.

There was also a break below the 1.3260 support zone and the 50 hourly simple moving average. It traded as low as 1.3207 on FXOpen and is currently consolidating losses. It recovered a few points above the 1.3230 level.

GBP/USD Hourly Chart


There was a break above the 23.6% Fib retracement level of the recent decline from the 1.3308 swing high to 1.3207 low.

The pair is now facing resistance near the 1.3260 level. It is close to the 50% Fib retracement level of the recent decline from the 1.3308 swing high to 1.3207 low. There is also a major bearish trend line forming with resistance near 1.3280 on the hourly chart of GBP/USD.

A close above the 1.3280 level could open the doors for more gains. The next major hurdle is near 1.3315 and the 50 hourly SMA, above which the pair could surge towards 1.3350.

On the downside, an immediate support is near the 1.3220 level. The next major support is near the 1.3200 level. If there is a break below the 1.3200 support, the pair could test the 1.3150 support. If there are additional losses, the pair could decline towards the 1.3050 level.

Read Full on FXOpen Company Blog...
 
ETHUSD and LTCUSD Technical Analysis – 09th DEC, 2021


ETHUSD: Ascending Channel Pattern Above $4,000

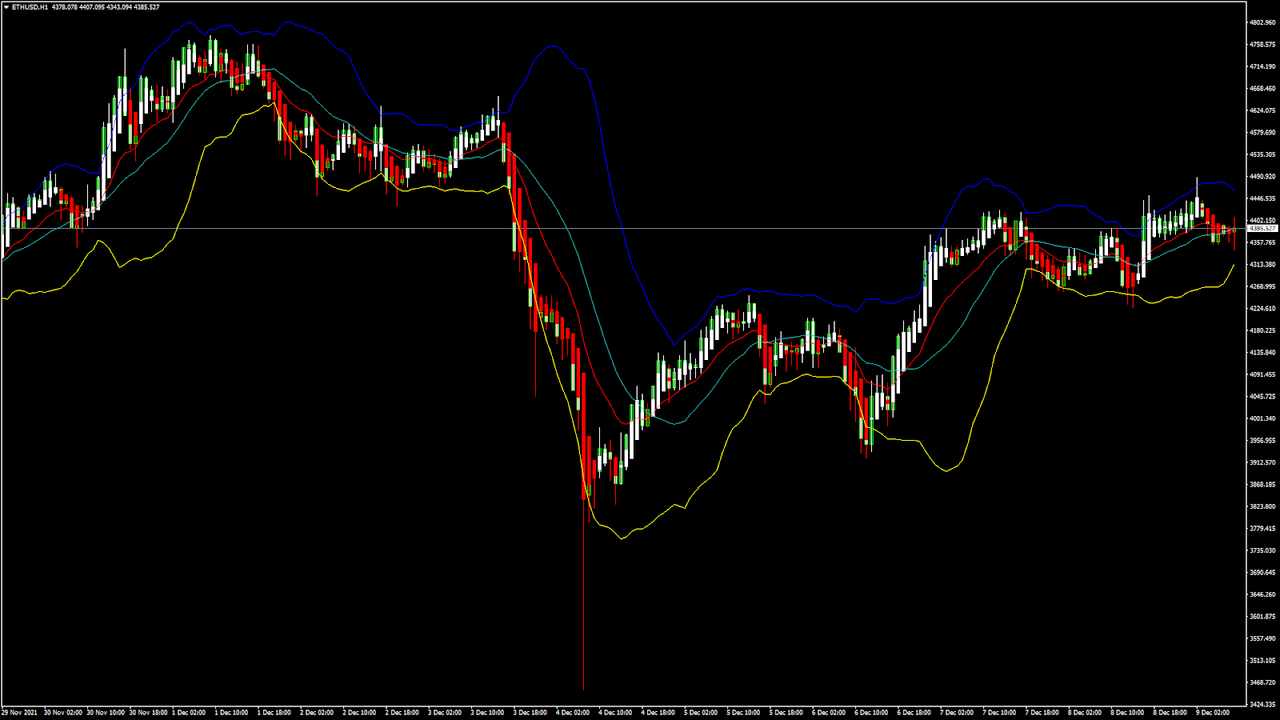
Ethereum continues its consolidation phase remaining above the $,4300 handle in the European trading session today.

ETHUSD is slowly preparing itself for its next move against the US dollar. The price continues to recover from its decline below the $4,000 level.

We can clearly see an ascending channel pattern above $4,000 which signifies that the price will continue to rise aiming upwards of $4,500 to $4,700.

ETH is now trading just above its pivot level of $4,374 and moving in a bullish ascending channel. The price of ETHUSD is about to break its classic resistance level of $4,418, its Fibonacci resistance level $4,403, and is now aiming towards the $4,500 handle in the US trading session.

All the major technical indicators are giving a NEUTRAL signal.

ETH is now trading above its 100 hourly and 200 hourly simple moving averages.

  • Ethereum continues a bullish channel
  • Short-term range appears to be bullish ETHUSD
  • All the moving averages are giving a STRONG BUY signal
  • Average true range is indicating LESSER market volatility

Ether: Bullish Trend Towards $4,700 Confirmed


In today’s early Asian trading session today, ETHUSD continues to move in a consolidation channel after touching an intraday high of $4,479 and an intraday low of $4,345 in the European trading session.

Today’s relative strength index is NEUTRAL which signifies a potential bullish trend.

It is best to enter into long positions in Ethereum at the present market level of $4,380 with a target of $5,000 for the next month.

The average true range is indicating a lower market volatility as we can see a drop of 11.76 in the trading volume as compared to yesterday. This is because the market was in a consolidation phase and the buyers were waiting for a bullish pattern, which is clearly visible now.

ETH has gained +0.55% with a price change of +23.84$ in the past 24hrs, and has a trading volume of 18.912 billion USD.

Bitcoin vs Ethereum Gains in 2021


The gains observed in Ethereum have been outstanding as compared to bitcoin during the same period of time. This is because Ether’s underlying technology is far superior to bitcoin’s, which only serves as a mode of payment transfer and Investments.

The demand for Ethereum is currently stronger due to its leading role in the emerging industry of decentralized finance (DeFi), as well as non-fungible tokens (NFTs).

The Week Ahead

Ether is printing above $4,300 today, and this week, we could see a levels of $4,500.

The medium to long-term outlook for Ether remains bullish with targets of above $5,000 the next month.

We have observed an $10 billion increase in Ethereum’s market cap which currently stands at $520 billion.

We have detected an MA50 crossover pattern which signifies a bullish trend in the coming days. A mullish crossover pattern is also seen in the MA20.

Technical Indicators:

Ultimate oscillator: at 49.448 indicating a NEUTRAL market

Moving averages convergence divergence (14-day): at 6.88 indicating a BUY

MA200 (exponential): at 4298.74 indicating a BUY

Rate of price change: at 0.403 indicating a BUY

Read Full on FXOpen Company Blog...
 
Gold Price Faces Hurdles While Crude Oil Price Is Recovering


Gold price is attempting a fresh increase above the $1,785 resistance zone. Crude oil price is recovering and could gain pace if there is a clear move above the $73.20 level.

Important Takeaways for Gold and Oil


  • Gold price is showing a few bearish signs below the $1,800 zone against the US Dollar.
  • There was a break below a key bullish trend line with support near $1,784 on the hourly chart of gold.
  • Crude oil price started a recovery wave above the $70.00 and $72.00 levels.
  • There was a break below a major bullish trend line with support near $72.30 on the hourly chart of XTI/USD.

Gold Price Technical Analysis

Gold price started a fresh decline from well above the $1,800 zone against the US Dollar. The price declined heavily, and it even broke the $1,780 support zone.

The price even settled below the $1,800 level and the 50 hourly simple moving average. Finally, there was a break below the $1,770 level. A low was formed near $1,761 on FXOpen before there was a recovery wave.

Gold price hourly chart


The price climbed above $1,780, but it stayed below $1,800. A high was formed near $1,792 and the price corrected lower. There was a break below the $1,785 level and the $1,780 support.

The price even traded below the 50% Fib retracement level of the upward move from the $1,761 swing low to $1,792 high. There was also a break below a key bullish trend line with support near $1,784 on the hourly chart of gold.

However, the bulls remained active near $1,774. The price is also stable above the 61.8% Fib retracement level of the upward move from the $1,761 swing low to $1,792 high.

An immediate resistance on the upside is near the $1,780 level and the 50 hourly simple moving average. The main resistance is near the $1,785 level. A close above the $1,785 level could open the doors for a steady increase towards $1,800.

The next major resistance sits near the $1,820 level. On the downside, an initial support is near the $1,774 level.

The first major support is near the $1,760 level. A downside break below the $1,760 support zone may possibly spark a steady decline. In the stated case, the price could test the $1,740 support.

Read Full on FXOpen Company Blog...
 
GBP/USD Aims Recovery While EUR/GBP Is Sliding


GBP/USD is attempting a recovery wave above the 1.3220 resistance. EUR/GBP is declining and is gaining pace below the 0.8550 level.

Important Takeaways for GBP/USD and EUR/GBP


  • The British Pound is facing resistance near the 1.3280 and 1.3300 levels.
  • There was a break above a major bearish trend line with resistance near 1.3240 on the hourly chart of GBP/USD.
  • EUR/GBP started a fresh decline from well above the 0.8580 support level.
  • There is a major bearish trend line forming with resistance near 0.8540 on the hourly chart.

GBP/USD Technical Analysis


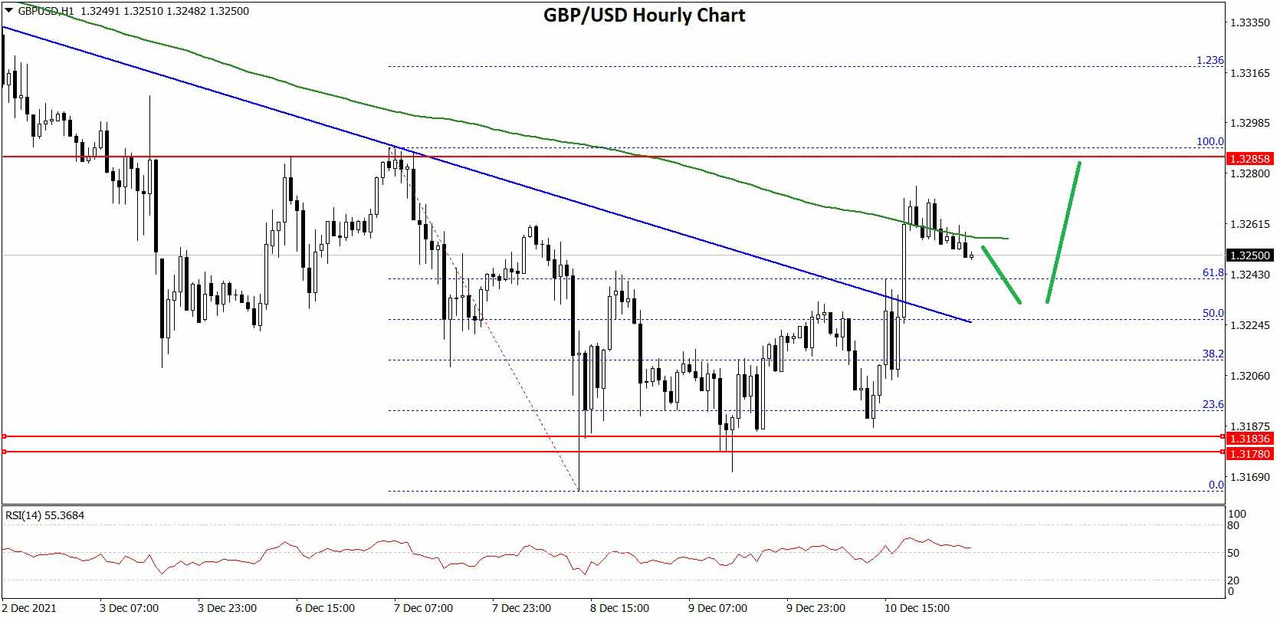
The British Pound declined heavily below the 1.3300 level against the US Dollar. The GBP/USD pair formed a base above the 1.3265 level and recently started an upside correction.

The pair recovered above the 1.3200 resistance level. There was a break above the 50% Fib retracement level of the downward move from the 1.3289 high to 1.3163 low (formed on FXOpen). Besides, there was a break above a major bearish trend line with resistance near 1.3240 on the hourly chart of GBP/USD.

The pair is now trading near the 1.3250 level and the 50 hourly simple moving average. It is close to the 76.4% Fib retracement level of the downward move from the 1.3289 high to 1.3163 low.

On the upside, an initial resistance is near the 1.3265 level. If there is an upside break above the 1.3450 resistance and the 50 hourly SMA, the price could surpass 1.3280. The main resistance is near the 1.3300 zone.

Therefore, a proper break above the 1.3300 resistance could open the doors for a steady increase. The next major resistance for the bulls could be 1.3350. If not, the pair could start a fresh decline below 1.3220. An immediate support is near the 1.3200 level.

The first key support is near the 1.3180 level. Any more losses could lead the pair towards the 1.3150 support zone. The next major support sits near the 1.3080 level.

Read Full on FXOpen Company Blog...
 
Will We See Santa Rally This December?


As this trading, pandemic-stricken year is nearing its end, the one thing left to emphasize is the stock market's rally. Not all market indices have rallied, for example, emerging markets: their indices performed poorer than developed markets by more than 20%.

The strongest rally happened in the United States. All major indices, Dow Jones, Nasdaq 100, and S&P 500, are nearing their all-time highs. Nothing could deter their advance. For most of the year, the tapering of asset purchases had been the main reason to expect a correction. The Fed did announce tapering, a small correction did happen, but only for bulls to step in and buy the dip again.

With the Fed's meeting looming large next week, is it possible for stocks to reach their new all-time highs? Also, is a Santa Rally possible even with the Fed turning hawkish?

What is a Santa Rally — and what are the chances to see one This December?
[

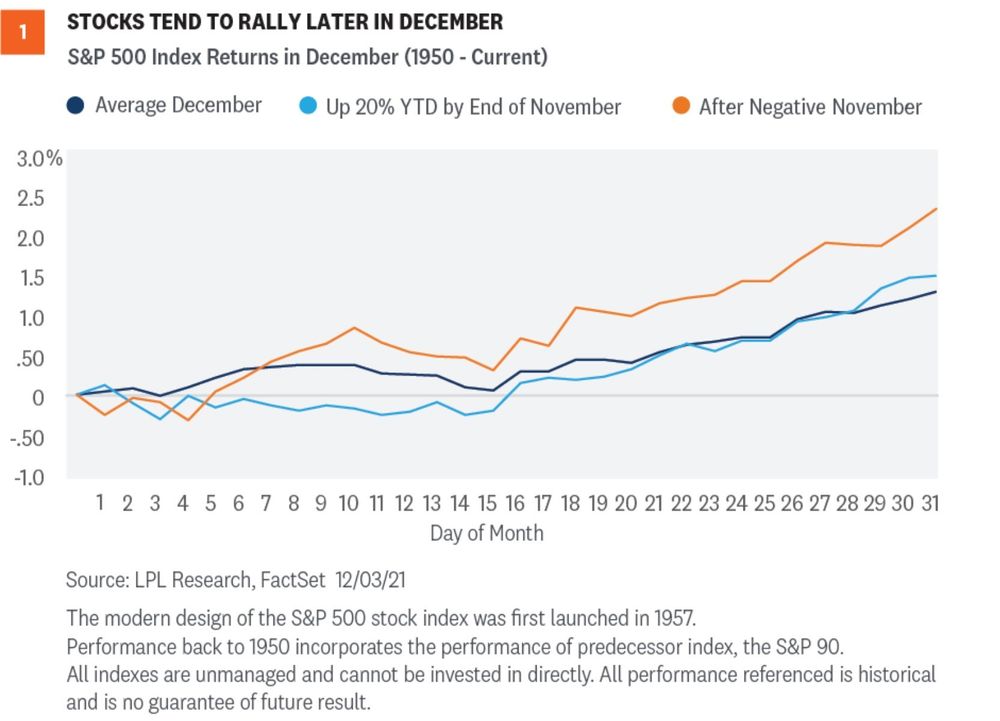
Stocks tend to rally later in December, hence the Santa Rally name. A close look at the chart above shows that the chances for a Santa Rally are quite high. Most rallies occur after December 20, and if, say, the S&P 500 goes up more than 20% YTD, as is the case this year, it will outperform the average December return. The performance record dates back to 1950, so it is fair to say the likelihood is high for the stock's rally going on.

Furthermore, after this year’s negative November, December has delivered a positive return of 2.7% on average, with a probability of 86.3%. In other words, investors are betting on continuation of the economic recovery despite Omicron fears and the Fed's intentions to tighten the policy.

All in all, a Santa Rally is not just a possibility but a probability; 86.3% is enough to keep buyers in control.

FXOpen Blog
 
Get Ready For December’s Most Important Trading Week


The most important trading week of the month has started, and traders are preparing for a sharp increase in volatility. No less than four central banks are expected to announce their monetary policy decisions, which will raise the currency market’s volatility.

Moreover, the moves may be exacerbated by lower liquidity levels typical for December. After all, December is known for most of the investment houses decreasing their market activity in light of the end-of-the-year holidays.

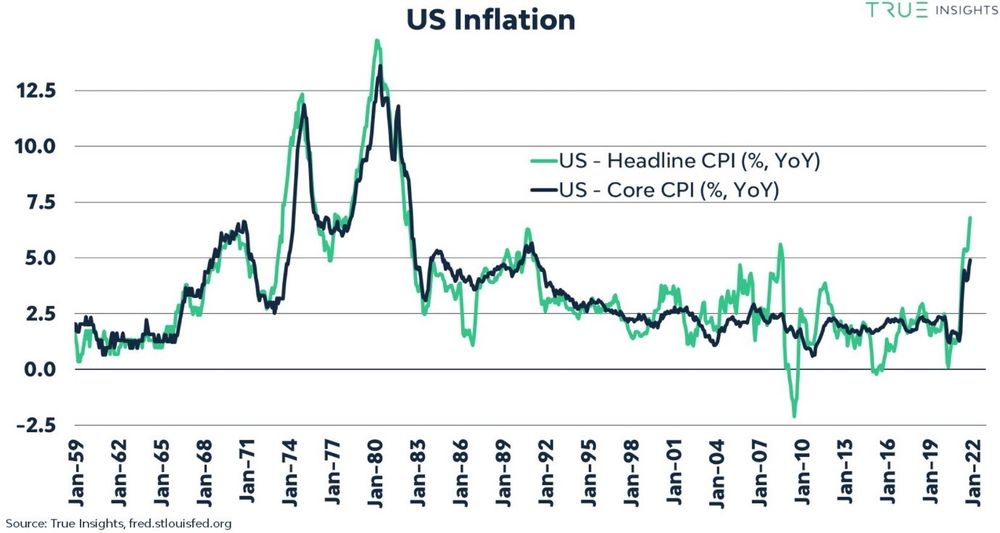
Inflation pressures central banks to tighten the monetary policy sooner than they would have wanted too. Last week, the US November inflation data showed that the prices of goods and services increased by 6.8% YoY, a rate not seen in the last 39 years. Therefore, the pressure on the Fed and other central banks increases to normalize their policies.


What to expect from the FOMC meeting on Wednesday

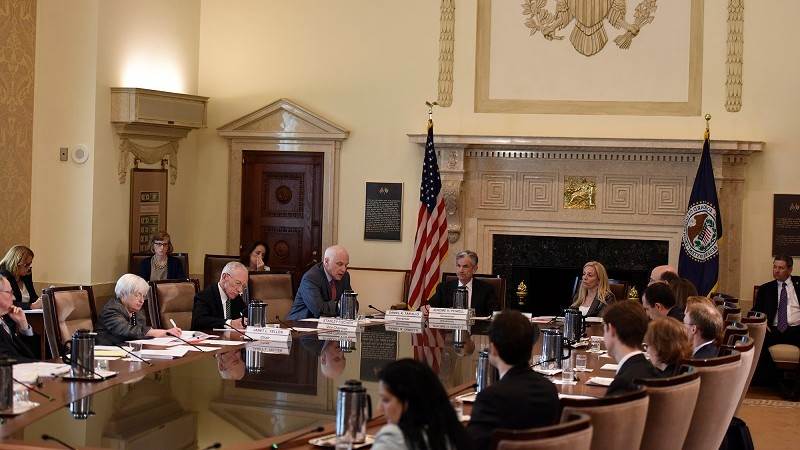
The Fed is due to announce its decision on Wednesday. The risk is that it will have a more hawkish tone than the markets expect as higher inflation is threatening the Fed’s mandate of price stability.

A couple of weeks ago, the Fed’s chair, Jerome Powell, announced that it is time to stop describing inflation as “transitory”. The problem with higher inflation in the States is that it will be exported to other parts of the world due to global trade partnerships, and also to the fact that the US is the largest economy in the world.

Three central banks to announce policy decisions on Thursday

One day after the Fed’s decision, three central banks will announce their monetary policy stance: the Swiss National Bank, the Bank of England, and the European Central Bank. Out of the three, the focus will be on the BOE and the ECB, because the Swiss National Bank is not expected to change its policy.

In the UK, while no rate hike is expected, the market participants will focus on the MPC asset purchase facility votes. Just like in the case of the Fed, the risk is that the BOE will be hawkish.

Finally, the ECB is facing a tough decision. The euro was weak all year, reflecting the bank’s dovishness. On the one hand, it does not plan to hike in 2022, in sharp contrast with the Fed. On the other hand, higher inflation forces its hand to taper asset purchases, a move that may be perceived as hawkish by financial markets.

This is what makes this trading week the most important in December. After Friday, volatility will decline as investors prepare for the end of the year festivities and holidays.

FXOpen Blog
 
BTCUSD and XRPUSD Technical Analysis – 14th DEC, 2021


BTCUSD: Head and Shoulders Pattern Below $50,000

Bitcoin was unable to sustain its bullish momentum on 12th Dec and declined after having touched a high of $50,701. We can observe a continuous fall since it touched its all-time high of $59,119 on 30th Nov.

This fall in BTCUSD can also be attributed to the broad-based December selling in crypto markets; this is a time when global investors seem to withdraw their profits and investments due to the upcoming Christmas and New Year holiday season.

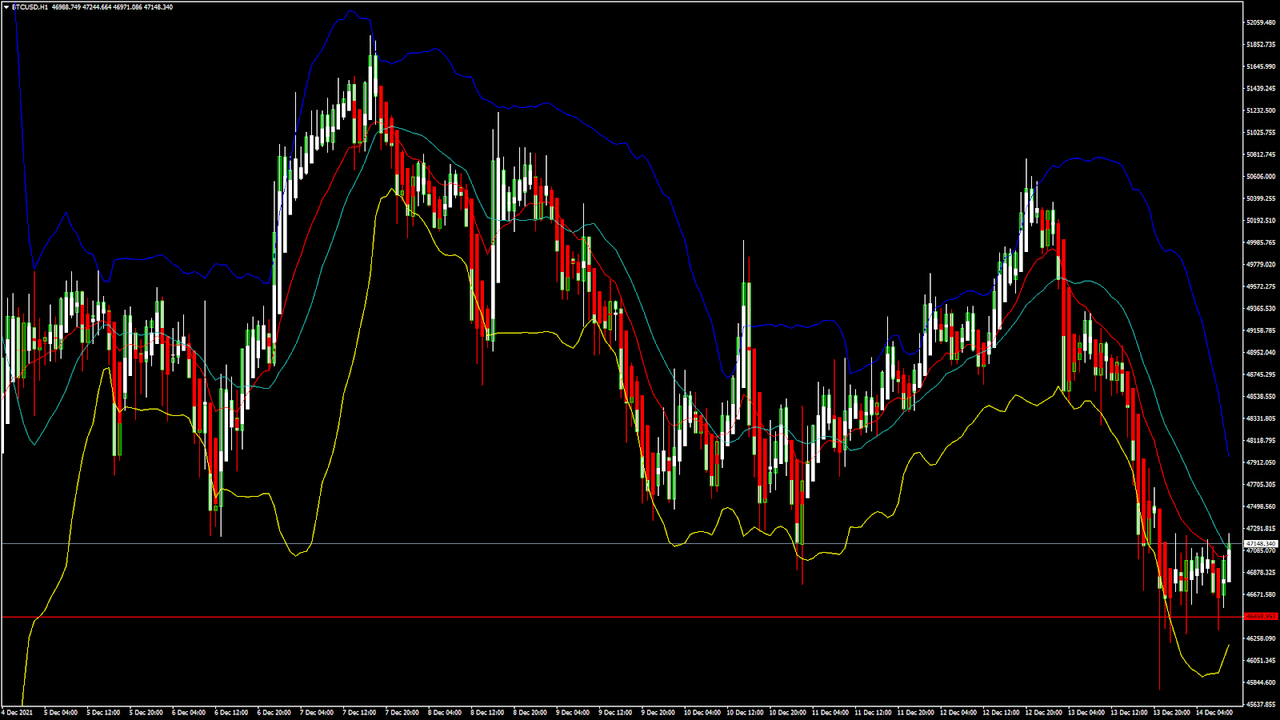
In today’s European trading session, bitcoin is again back in the bearish channel, trading below the $50,000 handle.

We can clearly see a head-and-shoulders pattern below the $50,000 handle which signifies a fall in the price of Bitcoin and a continuation of the bearish downtrend.

At present, the price of bitcoin has entered a consolidation phase below the $48,000, and this is expected to continue in the US trading session.

Both the Stoch and StochRSI are indicating an OVERBOUGHT level, which means that in the immediate short-term, a decline in the price is expected.

Bitcoin is moving below its both 100 hourly simple and exponential moving averages.

The average true range is indicating a lesser market volatility, which means that markets will be entering a consolidation phase soon.

  • Bitcoin trend reversal is seen below $50,000
  • Stoch is indicating an OVERBOUGHT level
  • The price is now trading just above its pivot level of $46,895
  • All the moving averages are giving a SELL signal at current market level of $47,146

Bitcoin: Bearish Momentum Below $50,000 Confirmed


BTCUSD is struggling to keep itself above the $50,000 mark, and we can see a mild bullish channel which suggests that a further decline can be expected.

Some of the major technical indicators are giving a SELL signal, which means that the price will fall below $45,000 soon.

In the European trading session, the price of BTCUSD is trading above its classic support level of $46,708 and Fibonacci support level of $46,594.

In the last 24hrs, BTCUSD has gone DOWN by 3.74% with a price change of $1,830, and has a 24hr trading volume of USD 33.547 billion. Compared to yesterday, there was a 41.25% increase in the trading volume. This increase happened thanks to the increased selling pressure, as well as liquidation of bitcoin holdings by investors.

The Week Ahead

Bitcoin continues tumbling down from its Nov 30th all-time high of $59,119. A further decline will push it below the $45,000 handle.

The medium to long-term outlook remains BULLISH for bitcoin, with a target of $55,000. At present, the markets are giving a SELL signal, so it would be best to enter into short positions.

The relative strength index of 42 is indicating a bearish channel, and fresh selling is expected in the markets at any time. This is also due to the renewed fears related to the Omicron coronavirus variant, and many countries shutting down their international borders.

Technical Indicators:

Stoch (9,6): at 98.95 indicating an OVERBOUGHT level

Average directional change (14-day): at 42.60 indicating a SELL

Rate of price change: at -0.837 indicating a SELL

Moving averages convergence divergence (12,26): at -447.70 indicating a SELL

Read Full on FXOpen Company Blog...
 
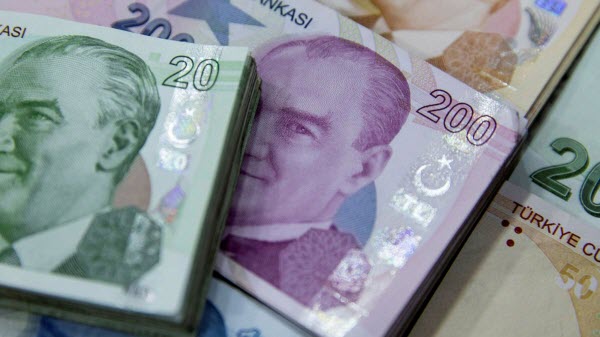
The low Turkish Lira and the tourism opportunity


Turkey, a huge nation which is home to over 84 million people, is in an interesting position economically and politically and has been for some time.

The current economic outlook is one of surprising doom, and the focus over the past day by mainstream economists in Western countries has been on the anticipation of a rate cut which has caused the Lira to plunge to a new low, which is quite a significant market event given that it began this month at a very low value.

Yesterday was a particularly interesting session for the Lira, given that it was trading at 14.33 to the dollar at 1:25 p.m. in Istanbul, representing a slight recovery from the record low of 14.99 earlier in the day but still languishing at all time lows.

The mere thought that a commonly-traded currency which is not a major and could be considered to be one of the 'exotics' which is often traded against majors would plunge to a lower value than ever recorded could well prove to be a point of interest among traders and market participants.

Turkey may well be having a fiscal apocalypse in the eyes of its own central bank and policymakers and financial leaders globally, as the nation's own central bank began to intervene directly in the FX market on Monday this week by selling dollars to prop up the lira, but there are two sides to this situation which could lead to some degree of volatility.

Whilst President Recep Tayyip Erdogan has taken a hardline stance against raising interest rates, Turkey's finance minister aligns with the idea as do many global economists which agree would actually aid the currency and go toward stemming the rampant inflation, which is now at approximately 20%.

Thus, the currency is in the doldrums but the wider economy of Turkey has perhaps some degree of potential, as it is one of the only countries within which tourism makes up a vast percentage of the national industry base which is welcoming tourists without many restrictions.

In 2018, Tourism directly accounted for 7.7% of total employment in Turkey, directly employing 2.2 million people and total income from tourism was 3.8% of GDP.

The nation's nominal per capita income - effectively the average salary per person - in Turkey is $9,300 which is considerably short of the national average per capita GDP in Western nations which are home to major currencies, which means that any movement in the all important tourist industry makes all the difference to the outlook within Turkey and therefore could directly affect the value of the Lira

Turkey's government has officially announced just three weeks ago that it will not be implementing any lockdowns going forward, and Turkey remains open to tourists.

Every year, over one million British tourists flock to Turkey's sun-soaked resorts and with those resorts very much open for business, the possibility of restrictions being implemented across the United Kingdom over the winter period and the low value of the Turkish lira meaning that British travelers get more bang for their buck, it could be that the Turkish economy may get a boost from those looking for an escape from further curtailment of freedoms to a warmer climate for a few weeks with a great exchange rate.

Many residents of Germany visit Turkey each year, some for vacation and others to visit their families and FX transactions between Germany and Turkey put the Euro and the Lira against each other very regularly.

Given Germany's current strict Covid rules, Turkey's low value Lira and open society with little restrictions may appeal.

Bearing in mind the internal issues of inflation and a beleaguered economy and the restrictions in Europe which may drive an open-for-business Turkish tourist industry forward, there may be some degree of volatility in the Lira when traded against the Euro or the Pound.

FXOpen Blog
 

Create an account or login to comment

You must be a member in order to leave a comment

Create account

Create an account on our community. It's easy!

Log in

Already have an account? Log in here.

Similar threads

Users Who Are Viewing This Thread (Total: 1, Members: 0, Guests: 1)

Top
AdBlock Detected

We get it, advertisements are annoying!

Sure, ad-blocking software does a great job at blocking ads, but it also blocks useful features of our website. For the best site experience please disable your AdBlocker.

I've Disabled AdBlock    No Thanks