Weekly Pivot Bounce Forex Trading Strategy
Often times, when we are presented a naked chart, it seems like we are staring at a nonsensical chart. Price seems to move in a very unpredictable manner, like a drunken man taking a random walk whose steps and direction goes all over the place. At least that is what most new traders would see.
This is especially true in a ranging or choppy market condition. Price would bob up and down, changing directions so often at very unpredictable price points. This is probably the reason why most newbie traders would try to avoid trading a ranging or choppy market.
But there is a way to make sense of these nonsensical, seemingly drunk random walk type of charts.
Pivot Points – A Great Tool for Ranging and Choppy Markets
There are many tools (trading indicators) available to a trader to help make sense of the market. Indicators that help make sense as to the trend direction of the market and area of possible interest. There are the moving averages, Fibonacci retracements, MACD, etc. However, not all indicators are great on all occasions. Sometimes, on a non-trending market environment, some indicators just can’t do the job. You must use the right indicator for the market condition you are trading in.
The Pivot Point indicator is a great tool to use in a ranging or choppy market environment. So good, many professional traders use it. It is a mathematically computed indicator that pinpoints areas of interest. Areas where price could possibly bounce off or breakout of. These are marked by horizontal lines or levels. The middle line is the Pivot Point (PP). Above it are three resistance levels – R1, R2 and R3. Below it are three support levels – S1, S2 and S3. Often times, as price approaches these levels, something interesting happens.
Pivot Points are great for ranging or choppy markets because of a simple concept that holds true even on these types of markets – Mean Reversion. Mean reversion is the idea that price would always go back to its average. The farther it wanders away from the mean, the more the likelihood it would reverse back to the average. Given that the Pivot Point is some form of an average of price, there is a good likelihood that price would revert back to it.
Another characteristic that works in favor of Pivot Points is that many professional and institutional traders consider it on their trades. Because of this, trading based on Pivot Points becomes a self-fulfilling prophecy. The mere fact that you could be trading in the same direction as the big boys only adds merits to trading using Pivot Points.
Trading Strategy Concept
The idea behind this strategy is to use the support and resistance levels as potential areas where price could bounce off. If price is below the pivot point, then we are looking for a bounce off one of the support levels. The target would be the next level above it. If on the other hand, price is above the pivot point, then we are looking for a bounce off a resistance level with the next level as the target.
But how do we determine if price is about to reverse? To do this, we will be using the good old pin bar candlestick pattern. Pin bar patterns are excellent indications of a possible reversal. The mere fact that sentiment changed within one period is a strong indication that the tides has changed, and a reversal could be taking place. Also, wicks are an indication of price rejection. Having wicks touching a support or resistance level is an indication that the market could be rejecting price at that particular support or resistance.
So, as price approaches one of the support or resistance levels, we are on the look out for a pin bar pattern pointing towards the Pivot Point’s middle level. If a pin bar appears, great, we have a trade setup. If no pin bar happens, then its fine. We stay on the sidelines waiting for the next opportunity to occur.
Indicators:
Currency Pair: any
Trading Session: any (preferably at a time when the currency’s market is open)
Buy (Long) Trade Setup
Entry


Sell (Short) Trade Setup
Entry


Conclusion
This is a strategy commonly used among many traders. Its strength is mainly in its high reward-risk ratio. Because of the distance that price could travel in between levels, the return could often be many folds compared to the risk on the stop loss.
However, not all setups would work out. There are times when a setup would occur, but price just don’t bounce off the support or resistance levels. We couldn’t do anything about that. It is just part of trading. We could however take into account the context of the pin bar candle. Did it occur at a time when the home market of one of the currencies is open? Did it occur at the open of a trading session or was it as the market was on a break or is about to close? Was it due to a fundamental news release? Etc.
There are also times when price would bounce off but just wouldn’t reach our target. This is normal because the next level are areas where price could also bounce off of. This is the reason why we set our targets a few pips before it. You could also employ some sort of trailing stop to protect your profits.
Although there are instances where setups could fail, it is still acceptable and with the right trader, could mean huge profits because of the high reward-risk ratio.
Study this concept. This strategy might be for you.
Often times, when we are presented a naked chart, it seems like we are staring at a nonsensical chart. Price seems to move in a very unpredictable manner, like a drunken man taking a random walk whose steps and direction goes all over the place. At least that is what most new traders would see.
This is especially true in a ranging or choppy market condition. Price would bob up and down, changing directions so often at very unpredictable price points. This is probably the reason why most newbie traders would try to avoid trading a ranging or choppy market.
But there is a way to make sense of these nonsensical, seemingly drunk random walk type of charts.
Pivot Points – A Great Tool for Ranging and Choppy Markets
There are many tools (trading indicators) available to a trader to help make sense of the market. Indicators that help make sense as to the trend direction of the market and area of possible interest. There are the moving averages, Fibonacci retracements, MACD, etc. However, not all indicators are great on all occasions. Sometimes, on a non-trending market environment, some indicators just can’t do the job. You must use the right indicator for the market condition you are trading in.
The Pivot Point indicator is a great tool to use in a ranging or choppy market environment. So good, many professional traders use it. It is a mathematically computed indicator that pinpoints areas of interest. Areas where price could possibly bounce off or breakout of. These are marked by horizontal lines or levels. The middle line is the Pivot Point (PP). Above it are three resistance levels – R1, R2 and R3. Below it are three support levels – S1, S2 and S3. Often times, as price approaches these levels, something interesting happens.
Pivot Points are great for ranging or choppy markets because of a simple concept that holds true even on these types of markets – Mean Reversion. Mean reversion is the idea that price would always go back to its average. The farther it wanders away from the mean, the more the likelihood it would reverse back to the average. Given that the Pivot Point is some form of an average of price, there is a good likelihood that price would revert back to it.
Another characteristic that works in favor of Pivot Points is that many professional and institutional traders consider it on their trades. Because of this, trading based on Pivot Points becomes a self-fulfilling prophecy. The mere fact that you could be trading in the same direction as the big boys only adds merits to trading using Pivot Points.
Trading Strategy Concept
The idea behind this strategy is to use the support and resistance levels as potential areas where price could bounce off. If price is below the pivot point, then we are looking for a bounce off one of the support levels. The target would be the next level above it. If on the other hand, price is above the pivot point, then we are looking for a bounce off a resistance level with the next level as the target.
But how do we determine if price is about to reverse? To do this, we will be using the good old pin bar candlestick pattern. Pin bar patterns are excellent indications of a possible reversal. The mere fact that sentiment changed within one period is a strong indication that the tides has changed, and a reversal could be taking place. Also, wicks are an indication of price rejection. Having wicks touching a support or resistance level is an indication that the market could be rejecting price at that particular support or resistance.
So, as price approaches one of the support or resistance levels, we are on the look out for a pin bar pattern pointing towards the Pivot Point’s middle level. If a pin bar appears, great, we have a trade setup. If no pin bar happens, then its fine. We stay on the sidelines waiting for the next opportunity to occur.
Indicators:
- PivotWeekly
Currency Pair: any
Trading Session: any (preferably at a time when the currency’s market is open)
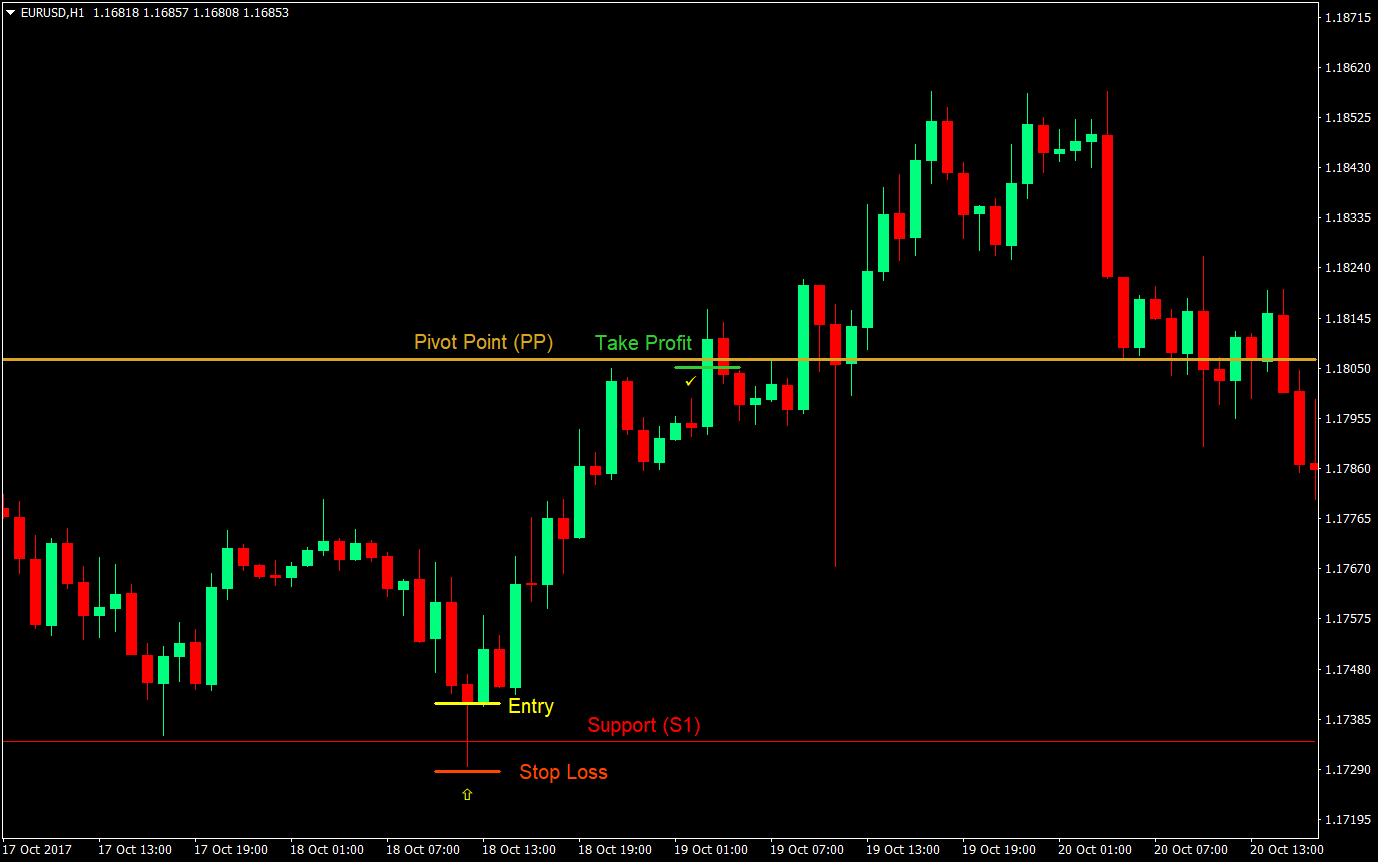
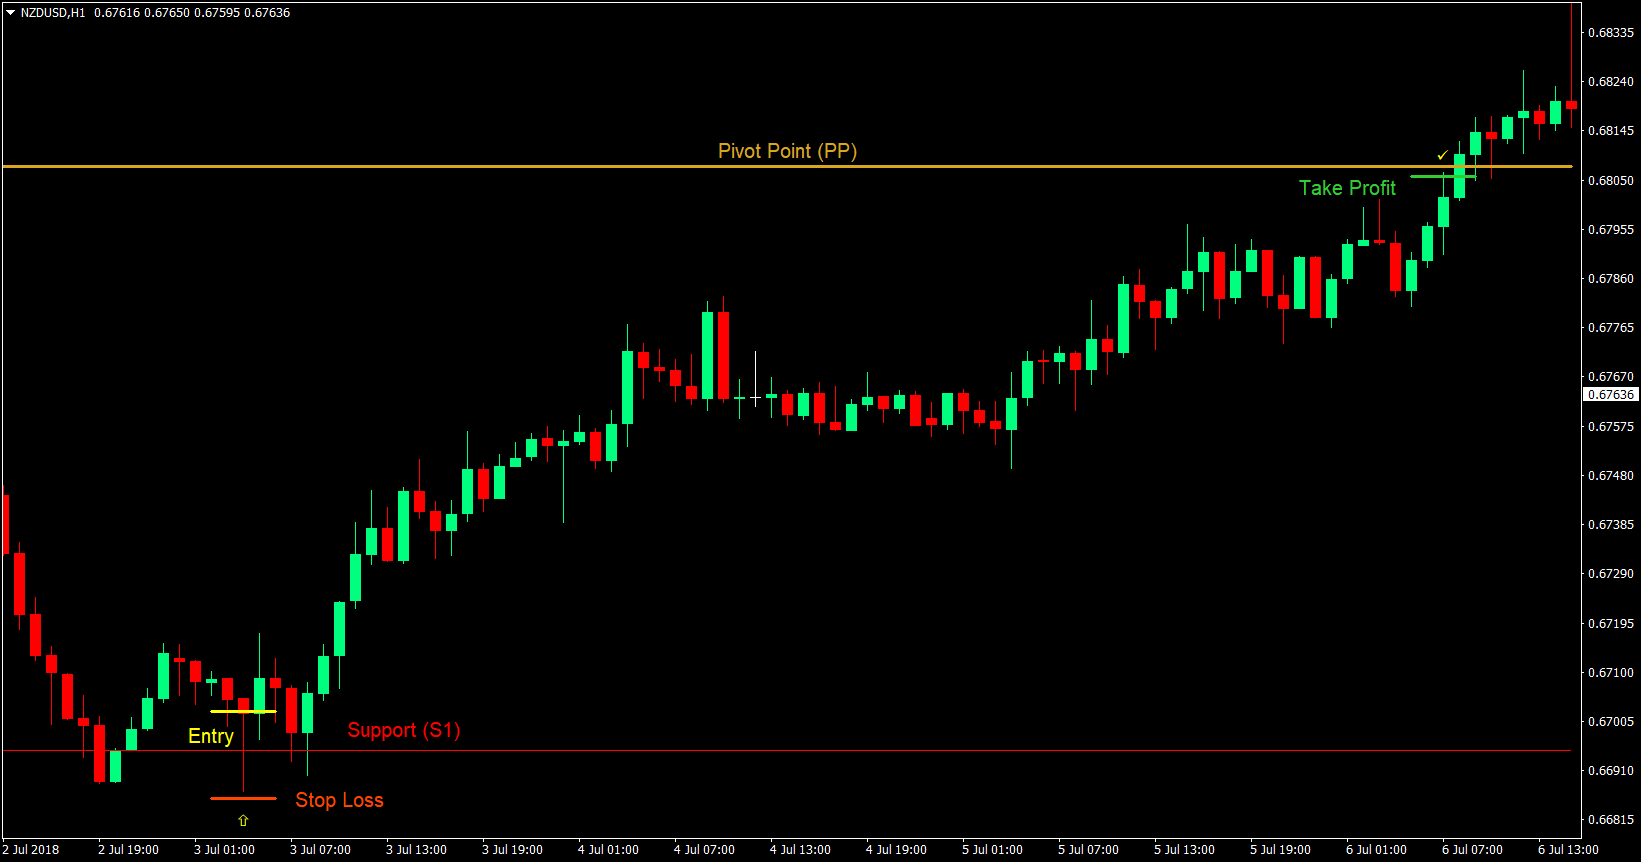
Buy (Long) Trade Setup
Entry
- Price should be below the weekly pivot point (goldenrod)
- Wait for price to approach one of the support levels (red)
- Wait for a pin bar pattern to occur with the wick touching the support level
- Enter a buy market order at the close of the pin bar candle
- Set the stop loss below the low of the pin bar candle
- Set the take profit target a few pips below the next level, either the pivot point or a support level


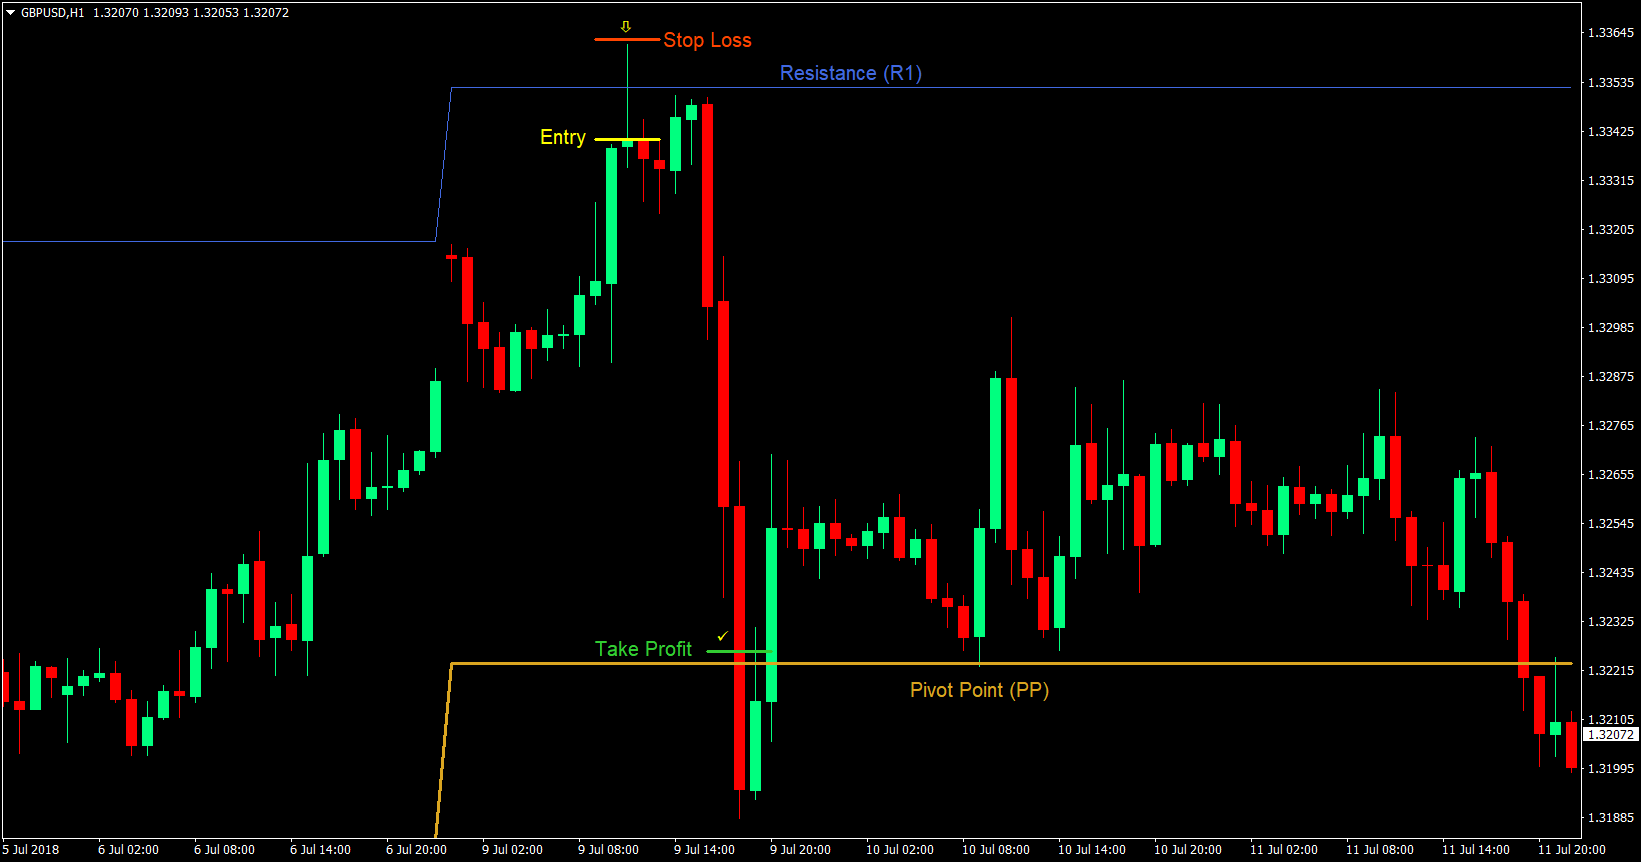
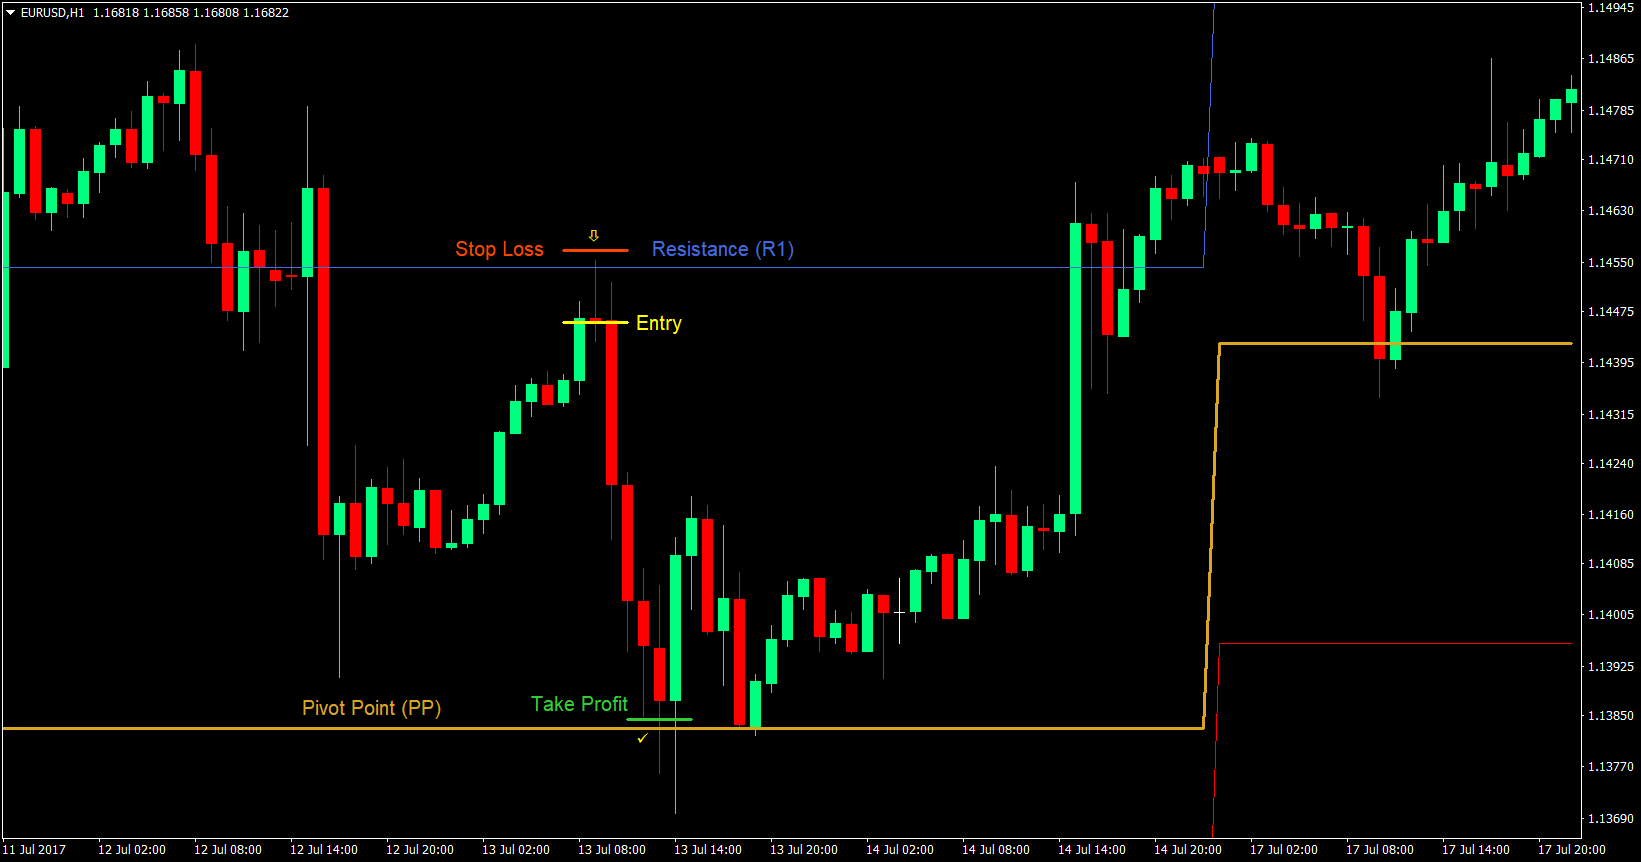
Sell (Short) Trade Setup
Entry
- Price should be above the weekly pivot point (goldenrod)
- Wait for price to approach one of the resistance levels (royal blue)
- Wait for a pin bar pattern to occur with the wick touching the resistance level
- Enter a buy market order at the close of the pin bar candle
- Set the stop loss above the high of the pin bar candle
- Set the take profit target a few pips above the next level, either the pivot point or a resistance level


Conclusion
This is a strategy commonly used among many traders. Its strength is mainly in its high reward-risk ratio. Because of the distance that price could travel in between levels, the return could often be many folds compared to the risk on the stop loss.
However, not all setups would work out. There are times when a setup would occur, but price just don’t bounce off the support or resistance levels. We couldn’t do anything about that. It is just part of trading. We could however take into account the context of the pin bar candle. Did it occur at a time when the home market of one of the currencies is open? Did it occur at the open of a trading session or was it as the market was on a break or is about to close? Was it due to a fundamental news release? Etc.
There are also times when price would bounce off but just wouldn’t reach our target. This is normal because the next level are areas where price could also bounce off of. This is the reason why we set our targets a few pips before it. You could also employ some sort of trailing stop to protect your profits.
Although there are instances where setups could fail, it is still acceptable and with the right trader, could mean huge profits because of the high reward-risk ratio.
Study this concept. This strategy might be for you.


