What's new

HubuFX Shares Trading Ideas

4.50 star(s) 2 Votes

HubuFX

Member
GBPUSD: Bullish Rebound from Key Support

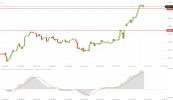
The GBPUSD currency pair recently underwent a test of the critical support base at 1.3090, from which it experienced a bullish rebound. In order to maintain the validity of the bullish trend scenario for the current day, it is necessary for the price to consolidate above this level. A breach of this support base would represent a negative factor, potentially causing the price to undergo an intraday bearish correction before resuming its upward direction. It is important to note that the next targets for the anticipated bullish trend begin at 1.3200 and extend to 1.3295.
gbpusd.jpeg
 
XRP

The US Federal Court’s ruling that XRP tokens are not securities has sparked a surge in XRP’s value, with a 70% increase since the decision. This momentum has also impacted Coinbase, a US-listed exchange currently facing a lawsuit from the SEC for offering unregistered securities, among other charges. The XRP precedent could potentially aid Coinbase in its legal battle with the regulator, and the same may apply to Binance. Despite not being listed, exposure to Binance is possible through its cryptocurrency, Binancecoin (BNB). The question remains whether the rise in XRP will continue and if it will trigger a rally in Coinbase, Binancecoin, and other cryptocurrencies. Many US cryptocurrency exchanges have already indicated their intention to allow XRP trading for US customers once again. The impact on Coinbase and Binancecoin appears modest, but it is important to note that XRP was trading at a low value prior to the decision.

 
USDJPY: Bearish Trend May Resume

The USDJPY currency pair has recently rebounded upwards after finding strong support at 137.24, testing the key resistance level of 139.15. Despite this, the price has consolidated below this level, suggesting that the bearish correctional trend may resume in the near future. The pair’s next goal is to revisit the 137.24 support level, with a potential break below this level pushing the price towards 135.9 as the next correctional target.


The Stochastic oscillator currently displays a negative overlap, indicating that bearish trades are likely to continue today.​
 
USDJPY Key Levels to Watch

The USDJPY currency pair is trading around 138.35 trying to stabilize the price above the demand zone at 137.33. The green long wick shadow candle-stick signals a continuation to the mail bullish trend. Continuing to the current market situation, please note that the price reacted downward to the 23.6 level of the Fibonacci Retracement which act as a minor support to the pair. The inverted hammer candle stick supports the sellers will in keeping the downtrend active.

The 23.6 level acts as today's resistance, the bullish trend would probably resume if the market can close above 139.4 in the 4H time-frame. On the other hand 137.33 is the main support, and a breach in this level will signal the continuation of the negative movements which was initiated from 145.


The USDJPY currency pair is currently trading around 138.35, as it attempts to stabilize its price above the key demand zone at 137.33. Notably, the appearance of a green long-wick shadow candlestick signals a potential continuation of the main bullish trend. In light of the current market situation, it’s important to note that the price has reacted downward to the 23.6 level of the Fibonacci Retracement, which is acting as a minor support for the pair. Furthermore, the presence of an inverted hammer candlestick further supports the sellers’ efforts to keep the downtrend active.

In terms of resistance, today’s level is at the 23.6 mark. If the market can close above 139.4 in the 4H time-frame, it’s likely that the bullish trend will resume. On the other hand, 137.33 serves as the main support level, and a breach of this level could signal a continuation of the negative movements that were initiated from 145.

In conclusion, key levels to watch for USDJPY on July 18th, 2023 include a support level at 137.33 and a resistance level at 139.4.


What is an Inverted Hammer

An inverted hammer is a type of candlestick pattern that is usually found after a downtrend and is often taken to be a trend-reversal signal. The pattern is made up of a candle with a small lower body and a long upper wick, which is at least two times as large as the short lower body. The body of the candle should be at the low end of the trading range, and there should be little or no lower wick in the candle.​
 
USDCHF Analysis: Bearish Trend and Potential Price Correction

The USDCHF currency pair is currently trading sideways between the lower low at 0.8567 and the lower high at 0.8631. The trend direction is strongly bearish in favor of the Swiss franc, with the MACD signaling an enormous divergence. Since the price action does not show strength in rising, it is likely that we will see a sideways trend and a correction to upper levels. If the price remains stable above 0.8567, it may lead to a price correction at higher levels around the 23.6 Fibonacci retracement level at 0.8706.


On the other hand, if the minor support at 0.8567 breaks, the bearish bias will probably resume. The next supply area is located approximately 300 pips away, around 0.8293. In this scenario, it is possible that the downtrend may continue in the upcoming days.

What is MACD Divergence?

In forex trading, divergence refers to a situation where the price of a currency pair is moving in the opposite direction of a technical indicator, such as the MACD or RSI. This can signal an imbalance between price and the oscillator, which may indicate an impending directional change in price. There are two types of divergences: regular divergence and hidden divergence. Each type of divergence can contain either a bullish or bearish bias.​
 
Silver: Bulls on the Prowl

Silver prices have been on the rise in recent days, trading above support at $24.53 for the third consecutive day. This has created a new higher low, which is a bullish technical signal. The price also tested support on July 17th and formed a long wick shadow candle, which indicates that bulls are pressing to push the price higher.

The next resistance level to watch is around $26.12. If silver can break above this level, it could signal the start of a new uptrend. However, if the price breaks below support at $24.53, it could indicate that the bullish trend is on hold. In this case, traders should monitor the price action closely before making any new decisions.


Fundamentally, the outlook for silver is also bullish. The global economy is growing, which is increasing demand for industrial metals like silver. Additionally, the recent sell-off in the stock market has led investors to seek out safe-haven assets like silver.​
 
XAUUSD

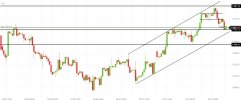
Gold is currently trading around the support level of $1,963 within an ascending channel. This could be a correction phase of the uptrend that began on June 29, 2023. If the market remains within the channel, it is likely that the upward movement will continue, targeting the previous high of $1,087.

On the other hand, if the bears succeed in pushing the price outside of the rising channel, the correction may continue to a lower support level starting at $1,945. At this time, we suggest monitoring the price action and waiting for a bullish candlestick to emerge before executing a buy order or exiting a sell order.

gold.jpeg

In terms of fundamental analysis, the gold market is currently supported by concerns about inflation and economic growth. Additionally, the US dollar is trading weaker, making gold more attractive to investors. However, there are also some headwinds facing the gold market from rising interest rates. The US Federal Reserve is expected to raise interest rates several times this year, which could put downward pressure on gold prices.​
 
EURJPY: How to Trade the Recent Price Action

The EURJPY currency pair has recently experienced a rise, holding steady near its last high, which is acting as a resistance level at 158. However, the price had a negative reaction to this resistance and started Monday with a decline. This could potentially be just a temporary correction before another surge in price. Despite the 158 resistance appearing fragile, a break could be imminent as long as the bulls are able to maintain control of the market above the rising trendline.


On the other hand, it is important to note that there is also support at 153.46, which correlates with the 23.6% Fibonacci retracement level. In the unlikely event that this support level is broken in a downward direction, the decline may continue to lower levels of the Fibonacci retracement. As always, it is important to carefully monitor market trends and make informed decisions when trading.​
 
Gold: Ready to Break 1972 as Bullish Trend Resumes

After touching the bottom line of the rising channel around $1,957, gold has resumed its bullish trend. The appearance of a long wick candlestick signaled the end of the correction, and the market is now stabilizing above the $1,961 support level. It is likely that the market will continue to rise, targeting $1,972 followed by $1,980. The market trend remains bullish, and the uptrend channel is expected to continue during today’s session.


On the other hand, if the $1,961 support level breaks, the market correction may test the next major support around $1,945. This level has acted as strong and valid support during the recent decline.

In terms of fundamentals, there are no major economic releases scheduled for today. As a result, the market is likely to focus on the ongoing conflict in Ukraine and the potential for further sanctions against Russia. These factors could continue to support gold prices as investors seek safe-haven assets.​
 
EURUSD Technical and Fundamental Outlook

The EURUSD currency pair has been experiencing an upward trend since October 2022. Currently, it is trading above its 1.1060 support level. Additionally, technical indicators such as the MACD and RSI are in neutral territory, suggesting a bullish outlook.

This morning, the EURUSD is trading close to the strong support at 1.1060. This price level provides a decent supply zone for the pair, and the price may bounce from here. In the near term, there are several factors that could support the EURUSD. Firstly, the European Central Bank (ECB) is expected to raise interest rates, which could make the euro more attractive to investors. Secondly, the US economy is showing signs of slowing down, which could weigh on the dollar.


As a result, the EURUSD is expected to continue its upward trend in the near term. The pair could test the 1.1200 level in the coming weeks. However, if the ECB does not raise interest rates as expected or if the US economy shows signs of improvement, the EURUSD could pull back.​
 
CHF Likely to Gain More Strength in Coming Weeks

The Swiss Franc has been gaining strength against the US dollar since November 2022. The pair is now trading at levels last seen in 2011, due to the franc's status as a safe haven currency and comments from the Swiss National Bank (SNB) about potential FX intervention.

The USDCHF currency pair bounced from the support at 0.8706, but the 4-hour chart shows a doji and long-wicked candle, suggesting that the franc is likely to gain more strength. The moving averages and technical indicators also suggest sell signals.


There are not many high-impact risk events on the calendar this week, but we do have US building permits later today, followed by CB Consumer Confidence and the FOMC meeting next week. The key to the FOMC meeting will be the comments by Fed Chair Powell, as well as any updates on the Fed's projections for the rest of the year.​
 
Gold Analysis: Price Line Resistance Acts as Support

Gold, the yellow metal, began the day with an increase and is currently trading at $1,971, clinging to the price line resistance that previously acted as support. The market is likely to move back to the channel since it was unable to break the 38.2 Fibonacci level. As long as the Fibo level holds, the bullish outlook remains valid. The price is likely to target $1,987 again, and the previous breakdown of the rising channel can be considered a false breakdown.


The 4-hour timeframe is the best for trading XAUUSD. This timeframe provides enough detail to identify trends and reversals while also capturing the overall market sentiment. In technical analysis, a price channel is a chart pattern that occurs when the price of an asset moves between two parallel trendlines. The upper trendline connects the swing highs in price, while the lower trendline connects the swing lows. The channel can slant upward, downward, or sideways on the chart.​
 
Thanks for your consistent analysis. I really enjoy reading your analysis and taking notes and comparing to my analysis before making a proper trading decision. Always helpful. Just wanted to let you know.
 
NZDUSD Poised for Breakout Above Resistance

The NZDUSD currency pair is poised for a breakout, and stabilizing the price above the 0.6246 resistance today. If the bulls are successful in achieving this important milestone, the New Zealand Dollar will be able to set its sights on new targets at higher levels of the Fibonacci retracement, starting with the 50 level and followed by the 61.8 level.

In this scenario, the risk of stop for long positions should be set at 0.6184 or the previous low around 0.6150. Additionally, the simple moving average indicator is currently acting as support around the 0.619 level. However, if this level is breached, the decline could continue to the 0.6056 level.


Overall, this is a critical moment for the NZDUSD currency pair, with the potential for significant gains if the bulls are able to maintain their momentum and push the price above the key resistance level.​
 
USDCAD: Is the Bear Market Over?

The USDCAD currency pair is currently testing the resistance level of 1.3235, which is also near the 50% Fibonacci retracement level. The RSI indicator has not yet reached the overbought level of 80 in the 4-hour time frame, indicating that there is still room for the bulls to push the price higher.

The candle sticks formed near the resistance level do not show any significant selling pressure from the bears. This suggests that the upward bias is likely to continue, with the 25 SMA acting as support for the bulls.

If the bulls are successful in breaking through the resistance level, their target will be the 61.8% Fibonacci resistance level. However, traders should also watch the price action closely for doji, long-wicked candles, or bearish engulfing candles, which could signal a reversal in the trend.


In general, the trend is bearish, and the current uptick movement can be considered a correction. However, if the bulls are able to break through the resistance level, the trend could shift to bullish.​
 
EURUSD: Key Levels to Watch in Upcoming Week

The Euro weakened against the US Dollar last week, but the overall uptrend for EURUSD remains. This is because the currency pair bounced off a rising support line from June, keeping the upward bias. If it continues to rise, the next resistance level is at 1.1231, followed by a zone between 1.1453 and 1.1495. If it falls, the next support levels are at 1.0834 and 1.0635.


On the 4-hour chart, positive RSI divergence shows that downside momentum is fading, which could mean a turn higher. If it rises, the next resistance levels are at 1.1182 and 1.12758. If it falls, the next support levels are at 1.0954 and a zone between 1.0833 and 1.0859.

 
Who has any thoughts about gold. What might happen next week. Will gold fall?​

Hello @utkir1981

Thank you for your question about the gold chart. We will review the chart and publish a new analysis for the upcoming week. We will share the link to the analysis with you once it is published.

We appreciate your interest in our community. Please do not hesitate to contact us if you have any other questions.​
 
EURUSD Strategy: A Closer Look at the 4-Hour Chart

The EURUSD currency pair is trading bullish above the trend line from May 31. However, it is important to note that the pair is below the pivot level at 1.104. There are several high-impact economic news releases scheduled for today in the euro zone, which could impact the pair's direction in the short term. Therefore, it is not recommended to trade this currency pair until the new data is released.


On a technical standpoint, the euro is bullish against the dollar as long as the pair is traded above the resistance line at 1.0966. Zooming in to the 4-hour chart, we see a bullish engulfing candle stick, which signals that the rising trend may continue. However, the pair could break the trend line if the economic data released today is disappointing for the euro area.


Traders should keep an eye on today's economic data and watch the market behavior closely before going long or short on the EURUSD currency pair.​
 

Create an account or login to comment

You must be a member in order to leave a comment

Create account

Create an account on our community. It's easy!

Log in

Already have an account? Log in here.

Similar threads

Users Who Are Viewing This Thread (Total: 1, Members: 0, Guests: 1)

Top
AdBlock Detected

We get it, advertisements are annoying!

Sure, ad-blocking software does a great job at blocking ads, but it also blocks useful features of our website. For the best site experience please disable your AdBlocker.

I've Disabled AdBlock    No Thanks