What's new

Forex Updates by Solid ECN

5.00 star(s) 1 Vote

Bearish Trend Expected for EUR/USD​


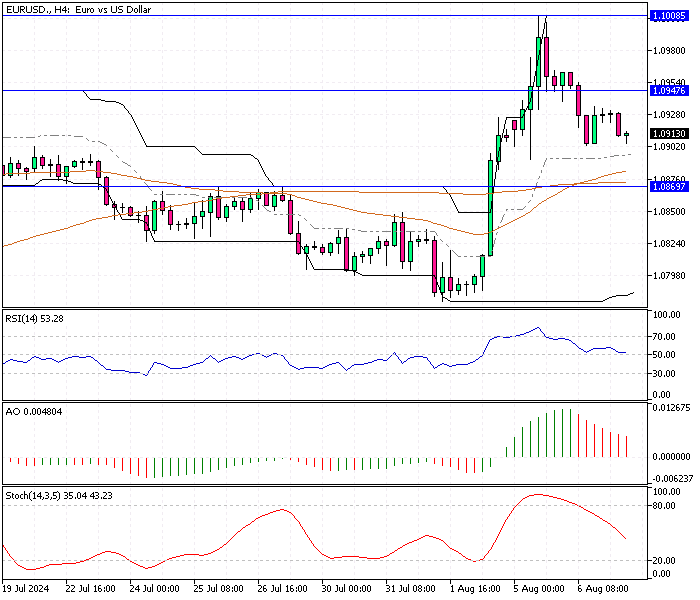
Solid ECN—The EUR/USD price returned from the 50-period simple moving average, and as of writing, the pair trades inside the bearish flag at approximately 1.081. The technical indicators suggest the primary trend is bearish and should resume.

From a technical standpoint, the price will likely test the 1.079 level in today's trading session. If the selling pressure exceeds 1.079, the next supply zone will be the 1.077 mark.

Conversely, the bear market should be invalidated if the EUR/USD price exceeds the key resistance level at 1.086, backed by the 100-period simple moving average.​
 

WTI Crude Oil Hits Key Resistance​


Solid ECN—WTI Crude Oil price reached the $78.1 key resistance, a demand zone backed by the 75-period simple moving average. Interestingly, the robust bullish momentum eased as the stochastic oscillator stepped into the overbought territory.

The technical indicators suggest the primary trend is bullish, but the oil price could be overvalued in the short term. Therefore, it is likely that the oil price consolidate near the immediate support at $77.1.

Conversely, the uptrend resumes if the bulls close and stabilize the price above $78.1. In this scenario, the next barrier will be the $79.2 mark.​
 

Bulls Eye $2,483 as XAU/USD Uptrend Resumes​


Solid ECN—Gold is in a bull market, testing the July 17 low at $2,451 as resistance. The technical indicators suggest the market is oversold, and the price might consolidate before the uptrend resumes.

However, the bears have tested the July 24 high at $2,431 today, and as a result, the price bounced, and the uptrend resumed. Therefore, if the XAU/USD price remains above $2,431, the next bullish target will likely be the July 17 high at $2,483.

Conversely, a dip below $2,431 could trigger the consolidation phase, extending to the next support level at $2,402.​
 

WTI Crude Oil Bounces from $76.7​


Solid ECN—The oil price dipped to $75.7 after breaking $78.1 with a long bearish candlestick. Currently, the price is bouncing from the key resistance at $75, while the awesome oscillator has flipped below the signal line.

There is no significant pattern on the WTI Crude Oil 4-hour chart, but the 1-hour chart shows a hammer candlestick and a MACD cross, indicating bullish momentum.

The price is likely to test the resistance at $75.7. However, if it dips below $75, the bullish outlook will be invalidated, potentially leading to a retest of July's low at $75.1.​
 

Oil Prices Test $72.6 Supply Zone​


Solid ECN—Oil prices dipped below the $75.1 support level, testing the $72.6 supply zone. The bearish pressure on the WTI Crude Oil price drove the stochastic oscillator into the oversold territory.

From a technical standpoint, we expected the price to consolidate before the downtrend resumed. That said, the price might bounce to fill the 'fair value gap' at approximately $75.1, which should be monitored for bearish candlestick patterns.​
 

GBP/USD: Downtrend Resumption Ahead?​


Solid ECN—The GBP/USD pair is in a bear market, trading below the 50 and 100-period simple moving averages. As of this writing, the price of the currency pair is stabilizing below the July 3 high of $1.277.

From a technical standpoint, the bear market is valid as long as the price is below the July 23 low at approximately $1.288. However, the price should dip below the immediate resistance at $1.271 for the downtrend to resume. If this scenario unfolds, the next bearish target will be the $1.261 mark.​
 

USD/CAD Poised for Potential Rebound​


Solid ECN—The USD/CAD pair recently declined from 1.394, testing the 100-period simple moving average (SMA) at 1.3786. As of this writing, the price is experiencing a pullback from the critical 1.378 support level. Meanwhile, the immediate resistance stands at 1.383, reinforced by the broken 50-period SMA.

From a technical standpoint, the uptrend will likely resume if the bulls close and stabilize the price above the 50-period SMA, approximately 1.383. Should this occur, the next target would likely be 1.388.

Conversely, if the bears push the price below the 100-period SMA, the downtrend could extend to the next key support at 1.375.​
 

EUR/USD at $1.09: Key Factors Impacting the Market​


Solid ECN—The Euro remained steady at $1.091 after reaching a seven-month high of $1.091. Traders are carefully analyzing the monetary and economic outlook. Poor economic data from the US has sparked fears of a significant slowdown or a potential recession in the world's largest economy, increasing the likelihood that the Fed may need to cut interest rates more sharply.

In Europe, traders expect more rate cuts from the ECB. They predict a total reduction of 90 basis points this year, with a 50 basis point cut scheduled in September. On a positive note, German factory orders unexpectedly rose by 3.9% in July, offering some hope for recovery in the struggling manufacturing sector.​
 

WTI Crude Rises Amid Middle East Tensions​


Solid ECN—WTI crude oil futures climbed to around $77 per barrel on Monday, marking the fifth consecutive day of gains. The rise is mainly due to ongoing supply concerns amid rising tensions in the Middle East.

Over the weekend, reports surfaced that an Israeli airstrike on a school used as a shelter in Gaza led to the deaths of at least 80 people and injured nearly 50 others. In addition, Hamas expressed doubts about participating in upcoming ceasefire talks scheduled for Thursday.

Oil prices were supported by positive economic data from last week, particularly strong US job numbers, which eased fears of a potential recession. Moreover, expectations for a US interest rate cut grew after some Federal Reserve officials suggested on Friday that inflation might be slowing enough to consider lowering rates as soon as next month, potentially increasing oil demand.​
 

Gold Holds Steady as Markets Await Key US Inflation Data​


Solid ECN—Gold prices held steady around $2,440 per ounce on Monday as investors awaited key US inflation data later this week, which could provide insight into the Federal Reserve's next moves on interest rates.

Many still expect the Fed to lower rates in September, with some officials suggesting last week that inflation may be slowing enough to justify a rate cut next month. However, after substantial US job numbers, the previous week eased fears of a recession, there is now some disagreement in the market about how significant the rate cut might be.

Gold's appeal as a haven also remained strong, bolstered by ongoing geopolitical tensions, including reports of another Israeli airstrike on Gaza and Moscow's warning of a 'tough response' to Ukraine's actions in Russia.

Investors will closely watch US producer inflation data on Tuesday and consumer inflation figures on Wednesday.​
 

Gold is Overpriced in Short-term​


Solid ECN—The gold price is overbought, testing the August 2 high at $2,477. The primary trend remains bullish, as the price is above the 50 and 100-period simple moving averages.

However, we expect the price to dip and test the July 17 low at $2,451 before the uptrend resumes. Moreover, if the price breaks below $2,451, the consolidation phase will likely resume near the July 24 high at $2,431.​
 

Bitcoin Bat Pattern: Key Price Levels Explained​


Solid ECN—Bitcoin’s 1-hour chart formed a bat pattern, testing the ascending trendline at approximately $58,700. The bullish outlook should be invalidated if the price dips below the ascending trendline. In this scenario, the decline will likely extend to $56,657.

Conversely, the $61,896 could be targeted if the bulls (buyers) close and stabilize the price above the descending trendline and the $60,467 immediate resistance.
 

Ethereum's Butterfly Pattern: Key Support Levels​


Solid ECN—Ethereum formed a butterfly pattern in the daily chart. As of writing, the ETH/USD pair is testing the 100-period simple moving average, while the stochastic oscillator is approaching the overbought territory on the 4-hour chart.


From a technical perspective, if the price remains above the ascending trendline and the 50-period SMA, Ethereum's outlook will likely involve testing the July 25 low at $3,083.

On the other hand, a dip below the August 12 low at $2,506 would cancel the bullish outlook. In this scenario, the next supply zone would be $2,303, followed by $2,111.​
 

Create an account or login to comment

You must be a member in order to leave a comment

Create account

Create an account on our community. It's easy!

Log in

Already have an account? Log in here.

Similar threads

Users Who Are Viewing This Thread (Total: 1, Members: 0, Guests: 1)

Top
AdBlock Detected

We get it, advertisements are annoying!

Sure, ad-blocking software does a great job at blocking ads, but it also blocks useful features of our website. For the best site experience please disable your AdBlocker.

I've Disabled AdBlock    No Thanks