What's new

Forex Updates by Solid ECN

5.00 star(s) 1 Vote

EUR/USD Analysis: Uptrend and Resistance Insights​


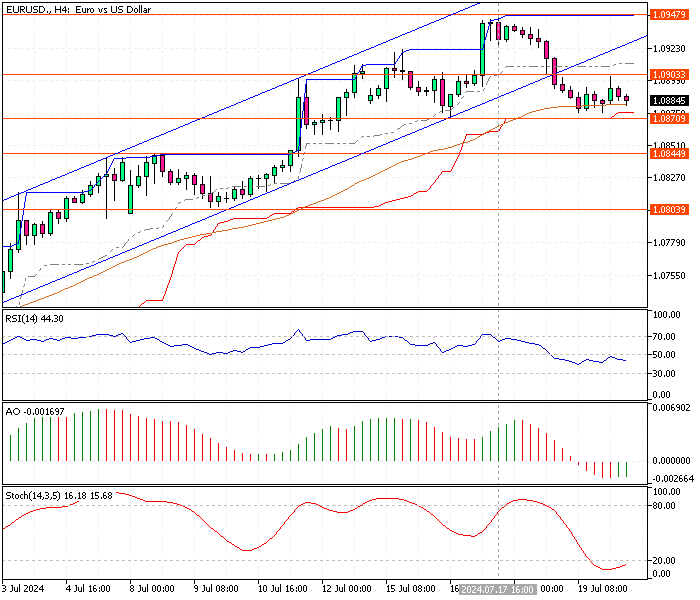
Solid ECN—The EUR/USD currency pair tests the 50-period simple moving average and the 1.0870 immediate support. The technical indicators in the 4-hour chart suggest the primary trend is bullish. However, the pair might be oversold because the Stochastic oscillator hovers below the 20 line.

The immediate resistance is at 1.090. The uptrend will likely resume if the bulls close a candle and stabilize the price above the immediate resistance. In this scenario, the next bullish target will be the July 17 high at 1.094.

Conversely, if the bears close below the immediate support at 1.084, the consolidation phase from 1.094 could extend to the next supply area at 1.0844.​
 

AUD/USD Oversold Signals Suggest Rebound​


Solid ECN—The RSI 14 and the Stochastic oscillator signal that the AUD/USD currency pair is oversold. Despite the bearish trend, we expect the price to bounce from the 0.665 support area. If this scenario comes into play, the price will likely test the upper line of the bearish flag, which coincides with the 61.8% Fibonacci level. The $0.668 level offers retail traders a decent ask price to join the bear market.

Please note that the bear market should be invalidated if the AUD/USD price stabilizes above the 50% Fibonacci.​
 

USD/JPY Nears Symmetrical Triangle Apex​


Solid ECN—The USD/JPY currency pair trades at approximately 157.8 in today's trading session, approaching the apex of the symmetrical triangle. The primary trend is bearish because the price is below the 50-period simple moving average. Other technical indicators suggest the downtrend should resume.

If the price dips below the ascending trendline and the immediate support of 156.28, the July 18 low at 155.35 will likely be tested. Furthermore, if the selling pressure exceeds 155.35, the next supply zone will be 154.4.

Conversely, the bearish outlook should be invalidated if the USD/JPY price exceeds the 38.2% Fibonacci at 157.8, a level backed by the 50 SMA.
 

USD/CHF Price Analysis Update​


Solid ECN—The USD/CHF price approaches the key resistance level at 0.891, while the stochastic oscillator signals an oversold market. The downtrend will likely resume if the price closes below the immediate support at 0.887. In this scenario, the sellers will initially target the 0.881 support.

Conversely, if the USD/CHF price exceeds the descending trendline, the bearish scenario should be invalidated, and the price can rise to test the 0.897 resistance.​
 

Silver Price Consolidates at $28.5 Low​


Solid ECN—Silver price started to consolidate after it hit the $28.5 low, which was expected because the stochastic oscillator was hovering in the oversold territory. The image above represents the XAG/USD 4-hour chart. However, the bears formed a shooting star candlestick pattern in the 1-hour chart, a bearish sign.

From a technical standpoint, the downtrend will likely resume, and the $28.5 supply area will be tested again if the price is below 23.6% Fibonacci.

Conversely, if the bulls (buyers) cross and stabilize the price above the immediate resistance at $29.3, the consolidation phase could test the 38.2% Fibonacci at $29.8.​
 

Fibonacci Analysis: Gold's Path to $2,483​


Solid ECN—Gold is stabilizing above the 38.2% Fibonacci at $2,411. The technical indicators suggest the uptrend should resume, but the price might consolidate before the uptrend continues.

The 100-period simple moving average is a key resistance level. The primary trend remains bullish as long as the price holds above $2,388. In this scenario, the next bullish target could be the 23.6% Fibonacci at $2,438. Furthermore, if the buying pressure exceeds $2,438, July's high at $2,483 could be retested.

Conversely, the bull market should be invalidated if the price dips below the 100-period simple moving average.​
 

Bitcoin's Bullish Signs: Will $70K Be Next?​


Solid ECN—Bitcoin's price is bouncing from the 50-period simple moving average, a support level that aligns with the July 17 high at $65,426. The stochastic oscillator demonstrates an oversold market, while other technical indicators suggest the bullish trajectory should resume.

That said, if the July 17 high holds, the $68,451 resistance will likely be tested again. Moreover, if the buying pressure exceeds this barrier, the bulls' way to the $70,000 psychological level could be paved.

Conversely, a close below the immediate support at $65,424 could trigger a consolidation phase, and the price could test the $63,265 supply area, backed by the 100-period SMA and the ascending trendline.​
 

Gold Hits Key Fibonacci Levels in Bear Market​


Solid ECN—Gold tests the 61.8% Fibonacci retracement level in today's trading session. The XAU/USD price is below the 50-period simple moving average, indicating that the bear market prevails. The technical indicators also suggest the bearish momentum should resume.

However, sellers must close and stabilize the price below the 61.8% Fibonacci level at $2,362 for the bear market to continue. If this scenario unfolds, the 78.6% Fibonacci level at $2,328 will be the next bearish target.

Conversely, the bear market should be invalidated if the price exceeds the 38.2% Fibonacci level at $2,408, a resistance backed by the 50-period SMA.​
 

Key Levels to Watch in XAG/USD​


Solid ECN—Silver closed below the 50-period simple moving average in the daily chart, a robust signal for the current downtrend. However, the stochastic oscillator stepped into the oversold territory, meaning the U.S. Dollar could be overvalued against Silver, and the market might bounce from this point or consolidate.

Going short in a market saturated with buying pressure is not advisable, and the daily chart demonstrates the price is testing the lower line of the bearish channel. That said, we expect the XAG/USD price to consolidate near the key resistance level at 28.5, which should be monitored for bearish signals such as a shooting star candlestick pattern or a bearish engulfing pattern.

Furthermore, please note that if the silver price closes above the $29.4 resistance, the bearish outlook should be invalidated.​
 

DAX 30 Faces Key Resistance at $18,148​


Solid ECN—The DAX 30 index struggles with the July 19 low at $18,148 resistance, which has held the selling pressure so far. Meanwhile, the stochastic oscillator has stepped into the oversold territory, indicating that the market could be saturated from the selling pressure.

From a technical standpoint, the primary trend is bearish. However, sellers must close below the $18,148 mark for the downtrend to continue. If this scenario unfolds, the July 2 low at $18,024 will likely be the next target.

Conversely, the price will likely consolidate if the bulls (buyers) stabilize above $18,189 before the downtrend resumes.​
 

USD/JPY Consolidation and Fibonacci Levels​


Solid ECN—The USD/JPY currency pair started to consolidate some of its recent losses in today's trading session, testing the 23.6% Fibonacci level at 154.2. The technical indicators suggest the current uptick momentum should resume to the 38.2% Fibonacci, a level coinciding with the descending trendline at approximately 155.68.

From a technical standpoint, a close above the 154.2 resistance could extend the consolidation phase to the 155.68 mark.

On the flip side, the downtrend will likely resume if the price dips below the immediate support at 153.3. If this scenario unfolds, the 151.9 key resistance will likely be tested.​
 

EUR/USD Downtrend Potential​


Solid ECN—The EUR/USD currency pair returned from the immediate resistance at 1.087, trading at about 1.082. The technical indicators suggest the price might decline further. However, the bears have the immediate support at 1.082 to overcome.

From a technical standpoint, the downtrend will likely extend to 1.080 if the EUR/USD closes below the immediate support.

Conversely, if the bulls (buyers) exceed the immediate resistance at 1.087, the road to the next resistance at 1.090 could be paved.​
 

USD/JPY: Bearish Flag and Candlestick Patterns Signal Trend Resumption​

[/url]

Solid ECN—The USD/JPY pair is consolidating inside the bearish flag, trading at approximately 153.6. The primary trend is bearish, and the price below the 50 SMA is proof of that. Although the technical indicators give mixed signals, the 4-hour chart has formed bearish candlestick patterns.

From a technical standpoint, the downtrend will likely resume if the price remains below the 155.3 key resistance. In this scenario, the 151.9 support could be tested. If the selling pressure dips the price below this immediate support, the 150.0 supply area will likely be targeted.​
 

Gold Prices Poised for a Breakout: Key Levels to Watch​


Gold trends are currently testing the 50-simple moving average at approximately $2,408, which also serves as the immediate resistance level. Technical indicators suggest that the uptrend may resume, and XAU/USD is not overvalued.

From a technical perspective, if the price of gold climbs above $2,408, the next bullish target will likely be $2,431.

Conversely, if sellers stabilize the price below the immediate support level of $2,353, the decline could extend to $2,339.
 

Key Indicators Suggest EUR/USD Consolidation​


Solid ECN—The EUR/USD downtrend cooled near the 1.080 resistance, while the awesome oscillator signals divergence. This development in the technical indicators means the market might step into a consolidation phase, or the trend might reverse from this point.

Additionally, the market is not oversold, as the stochastic and RSI hover above 30 and 20, respectively.

Therefore, we suggest retail traders wait patiently for the EUR/USD price to consolidate near the 50-period simple moving average. They should also monitor the 1.086 resistance area for bearish candlestick patterns or use a breakout strategy if the price exceeds 1.086.​
 

GBP/USD: Golden Cross Signals Potential Trend Reversal​


Solid ECN—The 50 and 100-period moving averages form a golden cross in the GBP/USD currency pair, suggesting a potential reversal from a bull market to a bear market. Additionally, the pair trades within a bearish channel, with bullish candlesticks appearing weaker and smaller than their bearish counterparts.

However, the Awesome Oscillator indicates divergence, which may signal that the pair could consolidate before resuming its downtrend. In this scenario, the GBP/USD price might rise to test the 100-simple moving average, approximately at 1.291. Traders and investors should closely monitor the 1.2911 resistance area for bearish signals.

Conversely, the bear market outlook would be invalidated if the GBP/USD price breaks above the key resistance level at 1.2941.​
 

Ethereum Bullish Momentum Slows at Critical Resistance​


Solid ECN—Ethereum's bullish momentum eased near the July 23 low of $3,373, encountering active resistance. Technical indicators suggest a sideways market with a mildly bullish bias.​
  • If the price closes above $3,373, it could allow bulls to reach the July 22 high of $3,561.
  • The July 27 low of $3,084 serves as the key support level for the current bull market.​
 

Silver Price Eyeing $28.5 Resistance​


Solid ECN—Silver price bounced from $27.3 as expected. The stochastic oscillator signaled oversold conditions, warning traders about this pullback. Currently, the XAG/USD bulls are testing the 100-period simple moving average as resistance. Meanwhile, the technical indicators suggest the primary trend is bearish, but the price might consolidate to upper resistance levels.

If the bulls surpass the immediate resistance at $28.5, the pullback will likely target the next demand area at approximately $29.4.

Conversely, if the silver price dips below the immediate support at $28.1, the current uptick trend should be invalidated, and the bears will likely test the recent lower low at $27.3.​
 

Bearish Momentum Expected Below 50 SMA​


Solid ECN—The NZD/USD pair is consolidating near the 50-period simple moving average. Meanwhile, the stochastic oscillator stepped into the overbought territory, signaling a sell.

Furthermore, the bearish momentum will likely resume if the price remains below the 50 SMA.​
 

Oil Prices Surge Amid Bullish Signals​


Solid ECN—Oil price returned from the $74.2 low when the stochastic oscillator signaled an oversold market. As of this writing, the pair trades at about $76.7, above the immediate support at $75.7. The technical indicators suggest the current uptick momentum should resume. Interestingly, the awesome oscillator adds to this bullish speculation.

From a technical standpoint, if the oil price holds above $75.7, the price will likely rise to the key resistance area at $78.1, backed by the 75-period simple moving average.

Conversely, if the bears (sellers) drive the price below $75.7, the $74.2 key resistance will likely be initially tested. Furthermore, if the selling pressure exceeds $74.2, the next support area will be the $71 mark.​
 

Create an account or login to comment

You must be a member in order to leave a comment

Create account

Create an account on our community. It's easy!

Log in

Already have an account? Log in here.

Similar threads

Users Who Are Viewing This Thread (Total: 1, Members: 0, Guests: 1)

Top