What's new

General EURUSD Chart Analysis

3.70 star(s) 30 Votes
  • The EUR/USD jumped to 1.0735, a fresh six-month high, during ECB Lagarde’s presser. It erases gains after Lagarde’s comments and turned its direction to downside and ended Thursday at around 1.0635, still bulish in the daily chart.
  • The European Central Bank raises key interest rates by 50 basis points to the highest levels since 2009. In the statement, the ECB said it expects to keep rising rates as inflation “remains far too high”. During the press conference, ECB President Christine Lagarde signaled that the next rate hikes will continue to be of 50 basis points.
  • In the US economic data came in mixed. On the positive side, Initial Jobless Claims dropped more than expected to 211K, the lowest level in weeks. Retail Sales in November fell by 0.6%, more than the 0.1% decline of market consensus. The Philly Fed recovered from -19.4 to -13.8. The Empire Index tumbled to -11.2 from 4.5. Industrial Production contracted 0.2% in November against expectations of a 0.1% expansion.
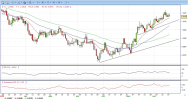
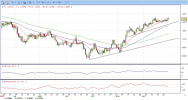
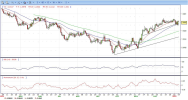
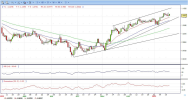
  • The EUR/USD pair is trading near the 1.0635, down for the day with bullish stance in daily chart. The pair stabilized above 20 and 50 SMA, indicates bullish strength. Meanwhile, the 20 SMA continued accelerating north and developing far above longer ones, suggests bulls not exhausted yet. On upside, the immediate resistance is 1.0670, break above this level will extend the advance to 1.0740.
  • Technical readings in the daily chart support the bullish stances. The RSI indicators hovering above the midline and stabilized around 65. The Momentum indicator stabilized above the midline, indicating upward potentials. On downside, the immediate support is 1.0590 and below this level will open the gate to 1.0500.
16-12EURUSD-D.png
 
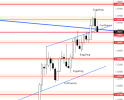
EURUSD Forecast – Key Level $1.05825 Under Testing

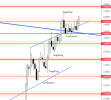
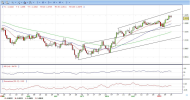
The price has started the week with an indecision candle where the price has touched $1.05825 resistance and $1.05087 as a support level.

Now the price is on the support level $1.05825 that should hold so the price can move again on higher levels.

Weekly time frame shows $1.05825 is still not broken on the upside, so we need to wait until the market manages to close the week above.

If the price closes below $1.05087 this will be a sign the price is heading to the demand zone to $1.03920 where the bulls were strongest and where the price could find a base for the next move up towards $1.07825.
EURUSD Daily Forecast 17_12_2022..png
 
Last edited by a moderator:
  • The EUR/USD remains subdued on Friday, following monetary policy meetings by the Fed and the ECB, with both entities raising rates amidst a period of high and stickier inflation. The pair ended Friday at around 1.0590, still bullish in the daily chart.
  • Investors' sentiment remains sour after worldwide central banks continue to tighten monetary conditions. A light US economic docket featured the release of the S&P Global PMI for December missed the estimates, reigniting recessionary fears in the US economy. Manufacturing PMI dived to 46.2 vs. 47.8 expected, while the Services Index slid to 44.4 from 46.5 foreseen. Consequently, the S&P Global Composite Index dropped to 44.6 against the estimated 46.9.
  • Meanwhile, the calendar was busy in the European session, with S&P Global PMIs released for the Euro area, France and Germany, with most of the figures being better than expected. Regarding the HICP, inflationary data for the Eurozone was 10.1% YoY, below the 10.6% of the previous month, though higher than the estimate of 10% reading. The core reading was unchanged at 5%.
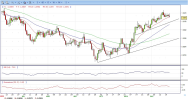
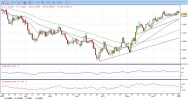
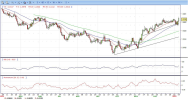
  • The EUR/USD pair is trading near the 1.0590, down for the day with bullish stance in daily chart. The pair stabilized above 20 and 50 SMA, indicates bullish strength. Meanwhile, the 20 SMA continued accelerating north and developing far above longer ones, suggests bulls not exhausted yet. On upside, the immediate resistance is 1.0670, break above this level will extend the advance to 1.0740.
  • Technical readings in the daily chart support the bullish stances. The RSI indicators hovering above the midline and stabilized around 64. The Momentum indicator stabilized above the midline, indicating upward potentials. On downside, the immediate support is 1.0580 and below this level will open the gate to 1.0500.
19-12EURUSD-D.png
 
  • The EUR/USD is trading flat for the day, hovering near 1.0600. During the American session, the pair fell to 1.0574, reaching the lowest level since December 13, but still bullish in the daily chart.
  • While German yields moved off highs during the Aercianesssion, Treasury yields printed fresh highs. As of writing, the US 10-year bond yield stands at 3.58% the highest in six days.
  • In Wall Street, the Dow Jones is falling by 0.13%, adding to last week's losses. The Nasdaq tumbles by more than 1%. Concerns about the global economic outlook as central banks continue to raise interest rates, weighs on market sentiment.
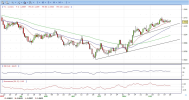
  • The EUR/USD pair is trading near the 1.0600, unchanged for the day with bullish stance in daily chart. The pair stabilized above 20 and 50 SMA, indicates bullish strength. Meanwhile, the 20 SMA continued accelerating north and developing far above longer ones, suggests bulls not exhausted yet. On upside, the immediate resistance is 1.0660, break above this level will extend the advance to 1.0740.
  • Technical readings in the daily chart support the bullish stances. The RSI indicators hovering above the midline and stabilized around 64. The Momentum indicator stabilized above the midline, indicating upward potentials. On downside, the immediate support is 1.0570 and below this level will open the gate to 1.0500.
20-12EURUSD-D.png
 
  • The EUR/USD pair seesaws between tepid gains/minor losses through the early North American session and is currently placed in neutral territory, around the 1.0600 mark, still bullish in the daily chart.
  • The Bank of Japan-inspired rally in the Japanese Yen is seen weighing on the USD, which, in turn, is seen lending some support to the EUR/USD pair. That said, a combination of factors continues to act as a tailwind for the greenback and keeps a lid on any meaningful upside for the major, at least for the time being.
  • Investors seem worried that a surge in COVID-19 cases in China could delay a broader reopening. This, in turn, overshadows the optimism over the easing of lockdown measures and takes its toll on the global risk sentiment. This is evident from a weaker tone around the equity markets and should benefit the safe-haven buck.
  • The EUR/USD pair is trading near the 1.0610, unchanged for the day with bullish stance in daily chart. The pair stabilized above 20 and 50 SMA, indicates bullish strength. Meanwhile, the 20 SMA continued accelerating north and developing far above longer ones, suggests bulls not exhausted yet. On upside, the immediate resistance is 1.0660, break above this level will extend the advance to 1.0740.
  • Technical readings in the daily chart support the bullish stances. The RSI indicators hovering above the midline and stabilized around 64. The Momentum indicator stabilized above the midline, indicating upward potentials. On downside, the immediate support is 1.0570 and below this level will open the gate to 1.0500.
21-12EURUSD-D.png
 
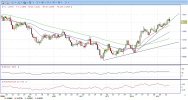
  • EUR/USD is moving in towards a price imbalance between 1.0580 and 1.0570 having already made a low of 1.0573. The price is coiled below the top of the bullish cycle up at 1.0763 and is breaking down the trend which leaves the bias to the downside, but still bullish in the daily chart.
  • The US Dollar recovered its shine on Thursday, and despite still trading within familiar levels against most of its major rivals, it currently stands near weekly highs. The Greenback got boosted by an upbeat US Gross Domestic Product report, as the Q3 GDP was upwardly revised from 2.9% to 3.2%.
  • Asian stock markets closed in the green, but European indexes ended the day with modest losses. Wall Street posted substantial losses, trimming all of its weekly gains. Also, the US Senate approved a $1.7 trillion government funding bill and passed it to the House, where it is expected to also pass before the end of the day.
  • The EUR/USD pair is trading near the 1.0590, down for the day with bullish stance in daily chart. The pair stabilized above 20 and 50 SMA, indicates bullish strength. Meanwhile, the 20 SMA continued accelerating north and developing far above longer ones, suggests bulls not exhausted yet. On upside, the immediate resistance is 1.0660, break above this level will extend the advance to 1.0740.
  • Technical readings in the daily chart support the bullish stances. The RSI indicators hovering above the midline and stabilized around 61. The Momentum indicator stabilized above the midline, indicating upward potentials. On downside, the immediate support is 1.0570 and below this level will open the gate to 1.0500.
23-12EURUSD-D.png
 
  • The EUR/USD pair holds comfortably above the 1.0600 round-figure mark through the early North American session and moves little in reaction to the mixed US macro data. It ended Friday near 1.0620, still bullish in the daily chart.
  • The US Bureau of Economic Analysis reported that the PCE Price Index rose a modest 0.1% in November, missing expectations for a reading of 0.3%. The slight disappointment, however, was offset by an upward revision of the previous month's reading to 0.4% and the higher-than-anticipated yearly rate of 5.5%.
  • Additional details showed that the Core PCE Price Index climbed by 0.2% MoM in November and decelerated to a 4.7% YoY rate from 5.0% previous. Separately, the US Durable Goods Orders missed consensus estimates by a big margin and does little to impress the US Dollar bulls or provide any impetus to the EUR/USD pair.
  • The EUR/USD pair is trading near the 1.0620, up for the day with bullish stance in daily chart. The pair stabilized above 20 and 50 SMA, indicates bullish strength. Meanwhile, the 20 SMA continued accelerating north and developing far above longer ones, suggests bulls not exhausted yet. On upside, the immediate resistance is 1.0660, break above this level will extend the advance to 1.0740.
  • Technical readings in the daily chart support the bullish stances. The RSI indicators hovering above the midline and stabilized around 65. The Momentum indicator stabilized above the midline, indicating upward potentials. On downside, the immediate support is 1.0570 and below this level will open the gate to 1.0500.
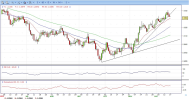
27-12EURUSD-D.png
 
EURUSD Forecast – Breakout Confirmed, Target $1.07825

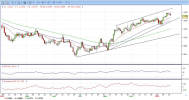
The price managed to continue to move up and eventually broke above $1.06736.

On Friday the price closed the day above $1.06736 resistance line which opened a door for the price for future move to the upside towards $1.07825.

If we take a look at the monthly time frame we can see the price has managed to close above the downtrend channel resistance line.

That means the price is free to move up and reach $1.07825 level.
EURUSD Daily Forecast 31_12_2022..png
 
Last edited by a moderator:
  • The EUR/USD advances modestly in the last trading day of 2022, during the North American session, though above its opening price by 0.13%. A light economic calendar keeps the EUR/USD pair within familiar ranges ahead of the week. At the time of writing, the EUR/USD is trading at 1.0705, still bullish in the daily chart.
  • Wall Street is set to open lower as US equity futures tumble with no fundamental catalyst. The US economic calendar is light, with the release of Chicago’s Purchasing Managers Index for December at 44.9, beating an estimate of 40. Thursday’s release of unemployment claims exerted downward pressure on the USD, weakening against most of the G7 currencies.
  • The US Dollar Index, a measure of the buck’s value against a basket of currencies, drops 0.33%, down to 103.634. Even though the greenback is falling, the US 10-year Treasury bond yield is rising five bps, at 3.869%.
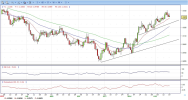
  • The EUR/USD pair is trading near the 1.0705, up for the day with bullish stance in daily chart. The pair stabilized above 20 and 50 SMA, indicates bullish strength. Meanwhile, the 20 SMA continued accelerating north and developing far above longer ones, suggests bulls not exhausted yet. On upside, the immediate resistance is 1.0740, break above this level will extend the advance to 1.0780.
  • Technical readings in the daily chart support the bullish stances. The RSI indicators hovering above the midline and stabilized around 67. The Momentum indicator stabilized above the midline, indicating upward potentials. On downside, the immediate support is 1.0570 and below this level will open the gate to 1.0500.
02-01EURUSD-D.png
 
  • The Euro (EUR) sheds some ground against the US Dollar (USD) on the first trading day of 2023 amidst thin liquidity conditions in the financial markets. The release of S&P Global PMIs in the Eurozone failed to bolster the shared currency on Monday. At the time of writing, the EUR/USD is trading at 1.0657 after hitting a daily high of 1.0699.
  • European equities are trading in the green. S&P Global revealed the Purchasing Managers Index (PMI) for factory activity in the EU, which came mixed with Spain and France’s Manufacturing PMI exceeding estimates, contrarily to Germany, which extended its downward trajectory to 47.1. Italy and the whole Euro area remained unchanged, each at 48.5 and 47.8.
  • In the meantime, the Bundesbank President and European Central Bank (ECB) policymaker Joachim Nagel crossed newswires on a German newspaper, and he said he’s optimistic that Germany can avoid a serious economic slump. Nagel added that the ECB was not seeing a wage spiral and reiterated that the ECB needs to take further action to curb inflation expectations.
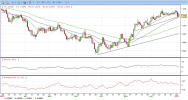
  • The EUR/USD daily chart suggests the pair might be peaking at around 1.0700, unable to crack in December, and it’s trimming some of its early gains, edged toward 1.0660s. Even though it broke above an eight-month-old downslope trendline, the EUR/USD faltered to extend its gains, opening the door for a re-test of the previously mentioned trendline at around 1.0550.
  • Technical readings in the daily chart support neutral. The RSI indicators started to aim down, suggesting that sellers are beginning to gather momentum. Therefore, the EUR/USD first support would be the 1.0600 mark, followed by the 20-day Exponential Moving Average (EMA) at 1.0584, ahead of 1.0550.
03-01EURUSD-D.png
 
  • The Euro (EUR) retraces against the US Dollar (USD) after hitting daily highs of 1.0635 and is dropping after the release of mixed US economic data, slightly boosted the US Dollar and shifting sentiment sour. At the time of writing, the EUR/USD is trading at 1.0616, above its opening price by 0.66%.
  • The EUR/USD fell below 1.0600 after the release of US economic data. November’s JOLTs report showed that the labor market remains tight, coming at 10.458M vs. 10.0M estimates, while October’s upward revision to 10.512M vs. 10.334M cemented the Federal Reserve’s (Fed) case for a 50 bps rate hike on February 1.
  • At the same time, the Institute for Supply Management (ISM) revealed the Manufacturing PMI index for December, which fell to 48.4, more than the 48.5 estimated by street analysts. Timothy R. Fiore, Chair of the ISM, noted, “The US manufacturing sector again contracted, with the Manufacturing PMI® at its lowest level since the coronavirus pandemic recovery began. With Business Survey Committee panelists reporting softening new order rates over the previous seven months, the December composite index reading reflects companies’ slowing their output.”
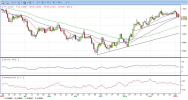
  • From a daily chart perspective, the EUR/USD remains neutral biased, seesawing around the 20-day Exponential Moving Average (EMA) at around 1.0583. Since today’s price action has failed to crack Tuesday’s high of 1.0683, the EUR/USD pair remains exposed to selling pressure. However, it should be said that the Relative Strength Index (RSI) bounced nearby the 50 mid-line, the EUR/USD key resistance levels are 1.0683, followed by the 1.0700 mark. On the flip side, the EUR/USD first support would be the 1.0600 mark, followed by the 20-day EMA at 1.0584 and the January 3 swing low of 1.0519.
05-01EURUSD-D.png
 
  • The selling pressure in the Greenback now picks up further pace and drags EUR/USD back to the mid-1.0500s on Thursday, or daily lows. Further downside could retest 1.0520, EUR/USD quickly returned to the negative territory in response to the abrupt uptick in the Greenback, which approaches the key 105.00 hurdle when measured by the USD Index (DXY).
  • The United States Challenger Job Cuts report showed that layoffs were down to 43.651K in December from 76.835K in the previous month. Additionally, the ADP survey on Employment Changed showed that the private sector created 235,000 new positions in the same month, much better than anticipated. Finally, Initial Jobless Claims declined to 204,000 in the last week of December. The upbeat figures hint at an upcoming solid December Nonfarm Payrolls report to be out this Friday. Also, the Euro Zone will publish fresh inflation data. The December Harmonized Index of Consumer Prices (HICP) is expected to have increased at an annual pace of 9.7%.
  • The drop in the pair also falls in line with the uptick in US yields across the curve, while the German 10-year Bund yields also reverse part of the recent weakness. Earlier in the euro docket, Germany’s trade surplus widened to €10.8B in November (from €6.9B) and the Construction PMI improved marginally to 41.7 in December. In the broader Euroland, Producer Prices contracted 0.9% MoM in November and rose 27.1% YoY. In Italy, flash inflation figures saw the CPI at 11.6% in the year to December.
  • Technical readings in the daily chart support the neutral to bearish stances. The RSI indicators hovering around 50. The Momentum indicator drop below the midline, indicating bearish potentials. On downside, the immediate support is 1.0470 and below this level will open the gate to 1.0400.
06-01EURUSD-D.png
 
  • The EUR/USD jumped above 1.0600 amid a sharp reversal of the US Dollar that tumbled across the board following the ISM Service PMI report. The pair rose 1.25% from the daily low and is having the best day in a month.
  • The first leg lower of the US Dollar followed the release of the Nonfarm Payroll report. The economy added 223K in December which represents a slowdown from the prior month and shows the job market remains in good shape. The unemployment rate dropped to 3.5%.
  • More recently, ISM Service PMI index came in at 49.6 in December, well below the 55 of market consensus. The Price Paid Index fell unexpectedly from 70 to 67.6. The report triggered concerns about a potential “hard landing” for the US economy. At the same time, the jobs numbers keep the debate open about the next Federal Reserve rate hike by 25 or 50 basis points.
  • After the figures, the Greenback accelerated the decline across the board as US yields tumbled. The US 10-year yield fell from 3.75% to 3.61%, the lowest level since December 20. European yields are also sharply lower. The German 10-year bond yield fell to 2.19%, the lowest since December 19, while the Italian 1-year fell to 4.19%.
  • Technical readings in the daily chart support the neutral to bulish stances. The RSI indicator is above 50. The Momentum indicator is also above the mid-line, indicating bullish potentials. On downside, the immediate support is 1.0600 and below this level will open the gate to 1.0540.
09-01EURUSD-D.png
 
  • EUR/USD leaves behind the 1.0700 barrier and hit a fresh multi-week high to 1.0750 region on the back of the persevering sell-off in the greenback, which comes with investors’ re-assessment of the potential next steps by the Federal Reserve when it comes to future interest rate hikes.
  • This change of perspective from market participants have been reignited soon after the publication of the December’s Non-farm Payrolls last Friday. Indeed, while the mixed tone from the monthly US labour market showed a still healthy job creation, the wage growth seems to have lost some momentum and that is what is leading traders to start pricing in some probable pause in the Fed’s hiking cycle.
  • On another page, and in the euro docket, the Unemployment Rate in the broader Euroland remained at 6.5% in November, while the Investor Confidence gauged by the Sentix Index improved a tad to -17.5 for the current month. Across the pond, the Consumer Credit Change will be the sole release as well as 3-month/6-month bill auctions.
  • EUR/USD has embarked on a strong recovery and has already surpassed the 1.0700 barrier. The extent and duration of the breakout, however, should hinge on the risk trends and dollar dynamics. In addition, the next steps regarding monetary policy – and particularly the ongoing tightening cycles - from both the ECB and the Fed will be crucial in determining the direction of the pair’s price action in the next months.
  • Technical readings in the daily chart support the bullish stance. The RSI indicator is above 50. The Momentum indicator is also above the mid-line, indicating bullish potentials. On downside, the immediate support is 1.0700 and below this level will open the gate to 1.0630.
10-01EURUSD-D.png
 
  • EUR/USD gives away some gains and returns to the negative territory following an earlier climb to new highs around 1.0880. It ended Monday at around 1.0815, still bullish in the daily chart.
  • Market participants were still cheering, easing United States price pressures and the possibility of a soon-to-come US Federal Reserve pivot on monetary policy. Optimism, however, faded at the beginning of a quiet week, with US markets closed amid the Martin L. King holiday.
  • Price action around the European currency should continue to closely follow dollar dynamics, as well as the impact of the energy crisis on the euro bloc and the Fed-ECB divergence.
  • The EUR/USD pair is trading near the 1.0820, slightly down for the day with bullish stance in daily chart. The pair stabilized above 20 and 50 SMA, indicates bullish strength. Meanwhile, the 20 SMA continued accelerating north and developing far above longer ones, suggests bulls not exhausted yet. On upside, the immediate resistance is 1.0880, break above this level will extend the advance to 1.0950.
  • Technical readings in the daily chart support the bullish stance. The RSI indicator is above 50. The Momentum indicator stabilizes in positive territory, indicating bullish potentials. On downside, the immediate support is 1.0770 and below this level will open the gate to 1.0710.
17-01EURUSD-D.png
 
  • The euro is under pressure on Tuesday, under control by bears and falling from a high of 1.0869 to a fresh low of 1.0773. It ended the day around 1.0790 and still bullish in the daily chart.
  • ECB policymakers are starting to consider a slower pace of interest-rate hikes after a likely 50 basis-point step in February, sources say as reported by Bloomberg.
  • However, President Christine Lagarde indicated in December, a higher pace of tightening than indicated above, laying down the foundations for a 50 basis-point step in February. Nevertheless, the prospect of a smaller 25-point increase at the following meeting in March now has traction in the markets, despite officials saying today that no decisions have been taken, and that policymakers may still deliver the half-point move for the March meeting that Lagarde penciled in on Dec 15.
  • The EUR/USD pair is trading near the 1.0790, down for the day with bullish stance in daily chart. The pair still stabilized above 20 and 50 SMA, indicates bullish strength. Meanwhile, the 20 SMA continued accelerating north and developing far above longer ones, suggests bulls not exhausted yet. On upside, the immediate resistance is 1.0870, break above this level will extend the advance to 1.0950.
  • Technical readings in the daily chart support the bullish stance. The RSI indicator is above 50. The Momentum indicator stabilizes in positive territory, indicating bullish potentials. On downside, the immediate support is 1.0770 and below this level will open the gate to 1.0710.
18-01EURUSD-D.png
 
  • Bulls remain in control of the sentiment around the single currency, with EUR/USD charting decent gains above the 1.0830 mark as the NY session draws to a close on Thursday.
  • Indeed, the selling interest around the greenback allows the continuation of the improvement in the risk complex and helps with the pair’s upside bias, while hawkish ECB-speak also props up the march north in spot. From the ECB, the Accounts of the latest meeting showed an initial attempt to hike rates by 75 bps and some participants advocated for a quicker reduction of the APP.
  • In the US calendar, Building Permits contracted 1.6% MoM in December and Housing Starts shrank at a monthly 1.4%. Additionally, Initial Claims went up by 190K in the week to January 14 and the Philly Fed Manufacturing Index improved to -8.9 for the current month.
  • The EUR/USD pair is trading near the 1.0835, up for the day with bullish stance in daily chart. The pair still stabilized above 20 and 50 SMA, indicates bullish strength. Meanwhile, the 20 SMA continued accelerating north and developing far above longer ones, suggests bulls not exhausted yet. On upside, the immediate resistance is 1.0890, break above this level will extend the advance to 1.0950.
  • Technical readings in the daily chart support the bullish stance. The RSI indicator is above 64. The Momentum indicator stabilizes in positive territory, indicating bullish potentials. On downside, the immediate support is 1.0760 and below this level will open the gate to 1.0710.
20-01EURUSD-D.png
 

Create an account or login to comment

You must be a member in order to leave a comment

Create account

Create an account on our community. It's easy!

Log in

Already have an account? Log in here.

Similar threads

Users Who Are Viewing This Thread (Total: 1, Members: 0, Guests: 1)

Top
AdBlock Detected

We get it, advertisements are annoying!

Sure, ad-blocking software does a great job at blocking ads, but it also blocks useful features of our website. For the best site experience please disable your AdBlocker.

I've Disabled AdBlock    No Thanks