What's new

Understanding and Utilizing the Exponential Moving Average (EMA) Effectively

4.00 star(s) 1 Vote

skrimon

Active Member
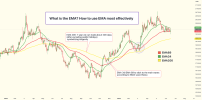
Understanding and Utilizing the Exponential Moving Average (EMA) Effectively.png
Hey everyone!

I wanted to share some insights about the Exponential Moving Average (EMA) and how it can be effectively used in trading. The EMA is a type of moving average that provides valuable signals and helps identify price trends. Let's dive into it!

Firstly, what is the EMA? The EMA is a weighted exponential formula-based moving average that is more responsive to recent price changes compared to a simple moving average (SMA). It smooths the price line and provides a clear indication of the price trend.

The EMA offers valuable signals to traders. It acts as a dynamic resistance and moves in the direction of the price. When the price increases, the EMA follows suit, and when the price decreases, the EMA remains above the price line. This aspect helps traders identify entry points accurately.

Now, which EMA should we use? It depends on the trading strategy and time frame. Here are some commonly used EMAs:

  1. EMA 9 or EMA 10: These EMAs are ideal for short-term transactions as they represent a two-week period of trading.
  2. EMA 34/EMA 89: These EMAs align with the primary waves according to the Elliott wave theory.
  3. EMA 20, EMA 50, EMA 200: These EMAs are closely associated with trading sessions. EMA 50 represents the medium term, equivalent to the four seasons in a year, with each season having around 50 trading sessions. EMA 20 represents the month.
  4. EMA 250 (in addition to EMA 200): Some traders believe that 250 represents the number of trading days in a year.
  5. EMA 100: EMA 100 is commonly chosen due to its round number value. Round numbers often act as psychological barriers in trading.

Comparing the trendline with EMA can provide further insights. While the trendline acts as a fixed resistance, the EMA is a dynamic resistance that closely follows the price line. It is calculated based on the price itself, making it more accurate in indicating the trend.

Here are a few important notes to keep in mind when using the EMA:

  • When the price surpasses or falls below the EMA and then retreats, it indicates a strong uptrend or downtrend.

  • If the price moves too far from the EMA, it's advisable to wait for a correction and its return to the EMA before considering trading actions.

  • Fast EMAs are more sensitive to price movements but are prone to breakdowns. They allow for early trend identification but experience more frequent short-term fluctuations.

  • EMAs act as dynamic resistance levels that consistently track the price line.

  • The EMA is not primarily used for pinpointing exact tops or bottoms but helps align trades with the prevailing trend.

  • The EMA has a slight delay, making the SMA more useful in sideways markets, while the EMA is more effective in clearly trending markets.

Remember, the EMA is a powerful tool, but it's always essential to combine it with other indicators and perform thorough analysis before making any trading decisions.

Happy trading and may the trends be in your favor!
 
Hey everyone!

I wanted to share some insights about the Exponential Moving Average (EMA) and how it can be effectively used in trading. The EMA is a type of moving average that provides valuable signals and helps identify price trends. Let's dive into it!

Firstly, what is the EMA? The EMA is a weighted exponential formula-based moving average that is more responsive to recent price changes compared to a simple moving average (SMA). It smooths the price line and provides a clear indication of the price trend.

The EMA offers valuable signals to traders. It acts as a dynamic resistance and moves in the direction of the price. When the price increases, the EMA follows suit, and when the price decreases, the EMA remains above the price line. This aspect helps traders identify entry points accurately.

Now, which EMA should we use? It depends on the trading strategy and time frame. Here are some commonly used EMAs:


  1. EMA 9 or EMA 10: These EMAs are ideal for short-term transactions as they represent a two-week period of trading.
  2. EMA 34/EMA 89: These EMAs align with the primary waves according to the Elliott wave theory.
  3. EMA 20, EMA 50, EMA 200: These EMAs are closely associated with trading sessions. EMA 50 represents the medium term, equivalent to the four seasons in a year, with each season having around 50 trading sessions. EMA 20 represents the month.
  4. EMA 250 (in addition to EMA 200): Some traders believe that 250 represents the number of trading days in a year.
  5. EMA 100: EMA 100 is commonly chosen due to its round number value. Round numbers often act as psychological barriers in trading.

Comparing the trendline with EMA can provide further insights. While the trendline acts as a fixed resistance, the EMA is a dynamic resistance that closely follows the price line. It is calculated based on the price itself, making it more accurate in indicating the trend.

Here are a few important notes to keep in mind when using the EMA:


  • When the price surpasses or falls below the EMA and then retreats, it indicates a strong uptrend or downtrend.

  • If the price moves too far from the EMA, it's advisable to wait for a correction and its return to the EMA before considering trading actions.

  • Fast EMAs are more sensitive to price movements but are prone to breakdowns. They allow for early trend identification but experience more frequent short-term fluctuations.

  • EMAs act as dynamic resistance levels that consistently track the price line.

  • The EMA is not primarily used for pinpointing exact tops or bottoms but helps align trades with the prevailing trend.

  • The EMA has a slight delay, making the SMA more useful in sideways markets, while the EMA is more effective in clearly trending markets.

Remember, the EMA is a powerful tool, but it's always essential to combine it with other indicators and perform thorough analysis before making any trading decisions.

Happy trading and may the trends be in your favor!
Is good EMA?
 
Hey everyone!

I wanted to share some insights about the Exponential Moving Average (EMA) and how it can be effectively used in trading. The EMA is a type of moving average that provides valuable signals and helps identify price trends. Let's dive into it!

Firstly, what is the EMA? The EMA is a weighted exponential formula-based moving average that is more responsive to recent price changes compared to a simple moving average (SMA). It smooths the price line and provides a clear indication of the price trend.

The EMA offers valuable signals to traders. It acts as a dynamic resistance and moves in the direction of the price. When the price increases, the EMA follows suit, and when the price decreases, the EMA remains above the price line. This aspect helps traders identify entry points accurately.

Now, which EMA should we use? It depends on the trading strategy and time frame. Here are some commonly used EMAs:


  1. EMA 9 or EMA 10: These EMAs are ideal for short-term transactions as they represent a two-week period of trading.
  2. EMA 34/EMA 89: These EMAs align with the primary waves according to the Elliott wave theory.
  3. EMA 20, EMA 50, EMA 200: These EMAs are closely associated with trading sessions. EMA 50 represents the medium term, equivalent to the four seasons in a year, with each season having around 50 trading sessions. EMA 20 represents the month.
  4. EMA 250 (in addition to EMA 200): Some traders believe that 250 represents the number of trading days in a year.
  5. EMA 100: EMA 100 is commonly chosen due to its round number value. Round numbers often act as psychological barriers in trading.

Comparing the trendline with EMA can provide further insights. While the trendline acts as a fixed resistance, the EMA is a dynamic resistance that closely follows the price line. It is calculated based on the price itself, making it more accurate in indicating the trend.

Here are a few important notes to keep in mind when using the EMA:


  • When the price surpasses or falls below the EMA and then retreats, it indicates a strong uptrend or downtrend.

  • If the price moves too far from the EMA, it's advisable to wait for a correction and its return to the EMA before considering trading actions.

  • Fast EMAs are more sensitive to price movements but are prone to breakdowns. They allow for early trend identification but experience more frequent short-term fluctuations.

  • EMAs act as dynamic resistance levels that consistently track the price line.

  • The EMA is not primarily used for pinpointing exact tops or bottoms but helps align trades with the prevailing trend.

  • The EMA has a slight delay, making the SMA more useful in sideways markets, while the EMA is more effective in clearly trending markets.

Remember, the EMA is a powerful tool, but it's always essential to combine it with other indicators and perform thorough analysis before making any trading decisions.

Happy trading and may the trends be in your favor!
Thank you for posting. This is useful!
 

Create an account or login to comment

You must be a member in order to leave a comment

Create account

Create an account on our community. It's easy!

Log in

Already have an account? Log in here.

Similar threads

Users Who Are Viewing This Thread (Total: 1, Members: 0, Guests: 1)

Top
AdBlock Detected

We get it, advertisements are annoying!

Sure, ad-blocking software does a great job at blocking ads, but it also blocks useful features of our website. For the best site experience please disable your AdBlocker.

I've Disabled AdBlock    No Thanks