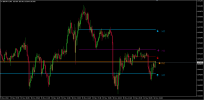
One of the most important discoveries I made as a trader was understanding how the lower time frames cycled into the higher time frames and vice versa. This was extremely useful but also very difficult to implement and even more confusing to understand.
There are always multiple trends happening in both directions on different time frames. This is evidence of the fractal nature of the markets. So for example the M5 may be trending up, the H1 and H4 could be trending down, and the W1 could be trending up, all at the same time. So how do you trade this?
You look for higher time frame structure and couple it with lower time frame entries. This way your targets can be based on higher time frame structure and you can see a clear picture of the fractality that the market is in.
This indicator helps with visualizing the market structure on every time frame by showing you where the order blocks are on every time frame. Keep in mind this is not a holy grail, you will have to work to understand how all the time frames work together. Once it clicks though, it will be like seeing the markets in the 3rd dimension after living your whole life viewing them through the 2nd dimension.
Please practice healthy risk management and enjoy.


