


As explained above, the most common moving averages are the simple moving average (SMA) and the exponential moving average (EMA). Almost all charting packages will have a moving average as a technical indicator.
The simple moving average is simply the average of all the data points in the series divided by the number of points.
The challenge of the SMA is that all the data points will have equal weighting which may distort the true reflection of the current market’s trend.
The EMA was developed to correct this problem as it will give more weighting to the most recent prices. This makes the EMA more sensitive to the current trends in the market and is useful when determining trend direction.
The mathematic formula for each can be found below:
Simple Moving Average:
SMA =


Where:
A= Is each of the data points
n = Number of time periods
For example, looking at a 5-day SMA on a daily chart of EUR/USD and the closing prices over the 5 days are as follows:
Day 1: 1.321
Day 2: 1.301
Day 3: 1.325
Day 4: 1.327
Day 5: 1.326
SMA = (1.321 + 1.301 + 1.325 + 1.327 + 1.326)/5
SMA = 6.6/5
SMA = 1.32
Exponential Moving Average:
EMA =
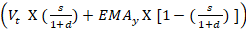

Where:
EMAt= EMA today
Vt= Value today
EMAt = EMA today
s =smoothing
d = number of days
Steps for calculating EMA:
1. Calculate the SMA for the particular time period
2. Calculate the multiplier for weighting the EMA using the formula:
[2 ÷ (selected time period + 1)]. So, for a 10-day moving average, the multiplier would be [2/(10+1)]= 0.01818.
3. Use the smoothing factor combined with the previous EMA to arrive at the current value.
For example, looking at a 10-day EMA for a share, the table below displays how the EMA would be calculated:
The simple moving average is simply the average of all the data points in the series divided by the number of points.
The challenge of the SMA is that all the data points will have equal weighting which may distort the true reflection of the current market’s trend.
The EMA was developed to correct this problem as it will give more weighting to the most recent prices. This makes the EMA more sensitive to the current trends in the market and is useful when determining trend direction.
The mathematic formula for each can be found below:
Simple Moving Average:
SMA =
Where:
A= Is each of the data points
n = Number of time periods
For example, looking at a 5-day SMA on a daily chart of EUR/USD and the closing prices over the 5 days are as follows:
Day 1: 1.321
Day 2: 1.301
Day 3: 1.325
Day 4: 1.327
Day 5: 1.326
SMA = (1.321 + 1.301 + 1.325 + 1.327 + 1.326)/5
SMA = 6.6/5
SMA = 1.32
Exponential Moving Average:
EMA =
Where:
EMAt= EMA today
Vt= Value today
EMAt = EMA today
s =smoothing
d = number of days
Steps for calculating EMA:
1. Calculate the SMA for the particular time period
2. Calculate the multiplier for weighting the EMA using the formula:
[2 ÷ (selected time period + 1)]. So, for a 10-day moving average, the multiplier would be [2/(10+1)]= 0.01818.
3. Use the smoothing factor combined with the previous EMA to arrive at the current value.
For example, looking at a 10-day EMA for a share, the table below displays how the EMA would be calculated:
| DATE | PRICE | 10-DAY SMA | SMOOTHING CONSTANT 2/(10 + 1) | 10-DAY EMA | |
|---|---|---|---|---|---|
| 1 | 24-Apr-18 | 23.24 | |||
| 2 | 25-Apr-18 | 22.99 | |||
| 3 | 26-Apr-18 | 22.85 | |||
| 4 | 27-Apr-18 | 23.00 | |||
| 5 | 28-Apr-18 | 22.96 | |||
| 6 | 29-Apr-18 | 22.21 | |||
| 7 | 30-Apr-18 | 21.99 | |||
| 8 | 1-May-18 | 22.43 | |||
| 9 | 2-May-18 | 22.24 | |||
| 10 | 3-May-18 | 22.55 | 22.65 | 22.65 | |
| 11 | 4-May-18 | 22.15 | 22.54 | 0.1818 | 22.56 |
| 12 | 5-May-18 | 22.39 | 22.48 | 0.1818 | 22.53 |
| 13 | 6-May-18 | 22.38 | 22.43 | 0.1818 | 22.50 |
| 14 | 7-May-18 | 22.61 | 22.39 | 0.1818 | 22.52 |
| 15 | 8-May-18 | 23.36 | 22.43 | 0.1818 | 22.67 |
| 16 | 9-May-18 | 24.05 | 22.62 | 0.1818 | 22.92 |
| 17 | 10-May-18 | 23.75 | 22.79 | 0.1818 | 23.07 |
| 18 | 11-May-18 | 23.83 | 22.93 | 0.1818 | 23.21 |
| 19 | 12-May-18 | 23.95 | 23.10 | 0.1818 | 23.35 |
| 20 | 13-May-18 | 23.63 | 23.21 | 0.1818 | 23.40 |