Seven Star FX
New Member
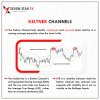
The Keltner Channel is a technical analysis tool used by traders to help identify potential trends, determine market volatility, and spot potential buy or sell signals in financial markets, such as stocks, currencies, or commodities. It consists of three lines plotted on a price chart:
The width of the channel can also indicate market volatility. A wider channel suggests higher volatility, while a narrower channel indicates lower volatility.
As with any technical analysis tool, traders often use the Keltner Channel in conjunction with other indicators and analysis methods to make informed trading decisions. It's important to consider other factors and not rely solely on the Keltner Channel for trading decisions.

- Middle Line (EMA or Exponential Moving Average): This line typically represents the average price of an asset over a specific period, often 20 periods. It serves as the midpoint for the channel.
- Upper Channel Line (Upper Band): This line is plotted above the middle line and is derived by adding a multiple of the Average True Range (ATR) to the middle line. The ATR measures market volatility, and by adding a multiple of it to the middle line, it forms the upper boundary of the channel.
- Lower Channel Line (Lower Band): This line is plotted below the middle line and is calculated by subtracting a multiple of the ATR from the middle line. It forms the lower boundary of the channel.
The width of the channel can also indicate market volatility. A wider channel suggests higher volatility, while a narrower channel indicates lower volatility.
As with any technical analysis tool, traders often use the Keltner Channel in conjunction with other indicators and analysis methods to make informed trading decisions. It's important to consider other factors and not rely solely on the Keltner Channel for trading decisions.


