MACD Retrace Forex Trading Strategy
Crossover strategies are a staple among many traders. This is probably because of its simplicity and its rules-based method. Though it is not perfect, but with the right parameters and filters it does work. However, as a trader, there will be many instances wherein you will miss your trading setup. You may be watching and waiting for a certain currency pair or trading instrument to crossover for some time, or you may be scanning your watchlist and notice that you’ve missed a crossover setup. Then you notice that price did rally going the direction of your trade and has started to trend. You end up just wishing you are on that trade, but you aren’t.
There is a way to enter the market even when you’ve missed your trading setup. This is through retracements and contractions. During this phase the market’s rally pauses for a bit, and it is the perfect opportunity for those who missed the initial trend burst to join in on the party.
The Moving Average Convergence-Divergence (MACD) Re-Entry
The Moving Average Convergence-Divergence (MACD) indicator is often used either as an entry signal on a trend change or as a trend direction filter. As an entry signal, entries are either triggered when on an overextended market condition, the market starts to rollover and the MACD Histogram and the MACD Signal Line starts to crossover heading back to zero, or on some trading strategies, entries are made when the MACD crosses over the midline or zero.
However, there is another use of the MACD that has been often overlooked. Believe it or not, the MACD could actually give signals of a re-entry opportunity while at the same time confirming that the trend is still going the same direction. How do we do this?
This is through the crossover of the histogram and signal line. When a trend changes, the MACD often crosses over the zero line, which confirms to most MACD traders that the trend has been established. However, even though the trend is already established, it rarely is a smooth sailing travel going the direction of the trend. There will often be minor retraces. These retraces often causes the histogram and signal line to crossover for a few candles, before it resumes its trend.
Trading Strategy Concept
This strategy will be built around re-entering the market as the retracements or contractions end as confirmed by the MACD histogram and signal line.
First, we will have our trend direction filters. These will be our 14-period and 50-period Exponential Moving Average (EMA). The basis of the trend is on how these two moving averages are stacked, having the faster EMA above the 50 EMA on an uptrend, and vice versa.
We will also use the MACD as a confirmation of the trend direction by using its midline. If both the MACD Histogram and MACD Signal Line are above zero, then our bullish direction is confirmed, and vice versa.
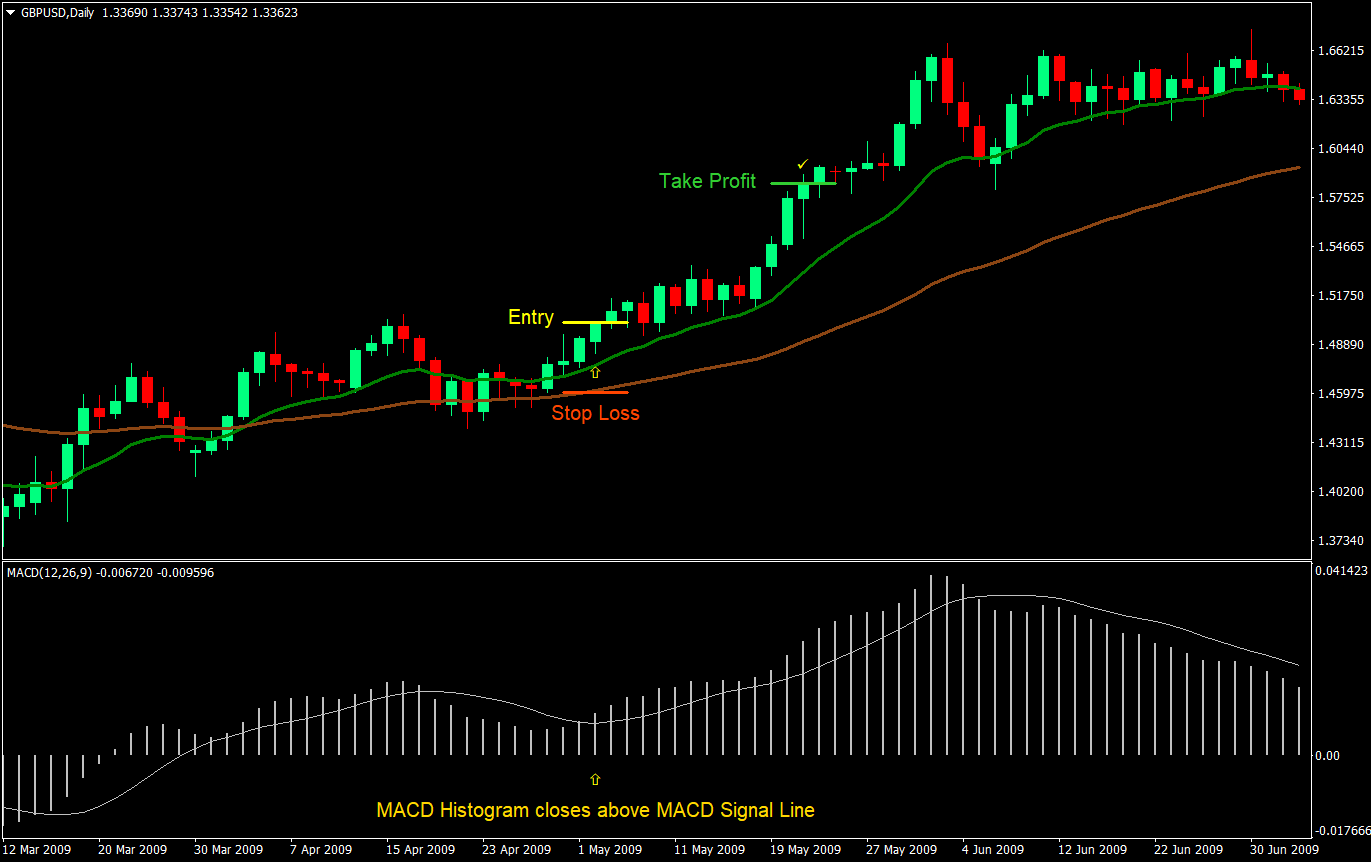
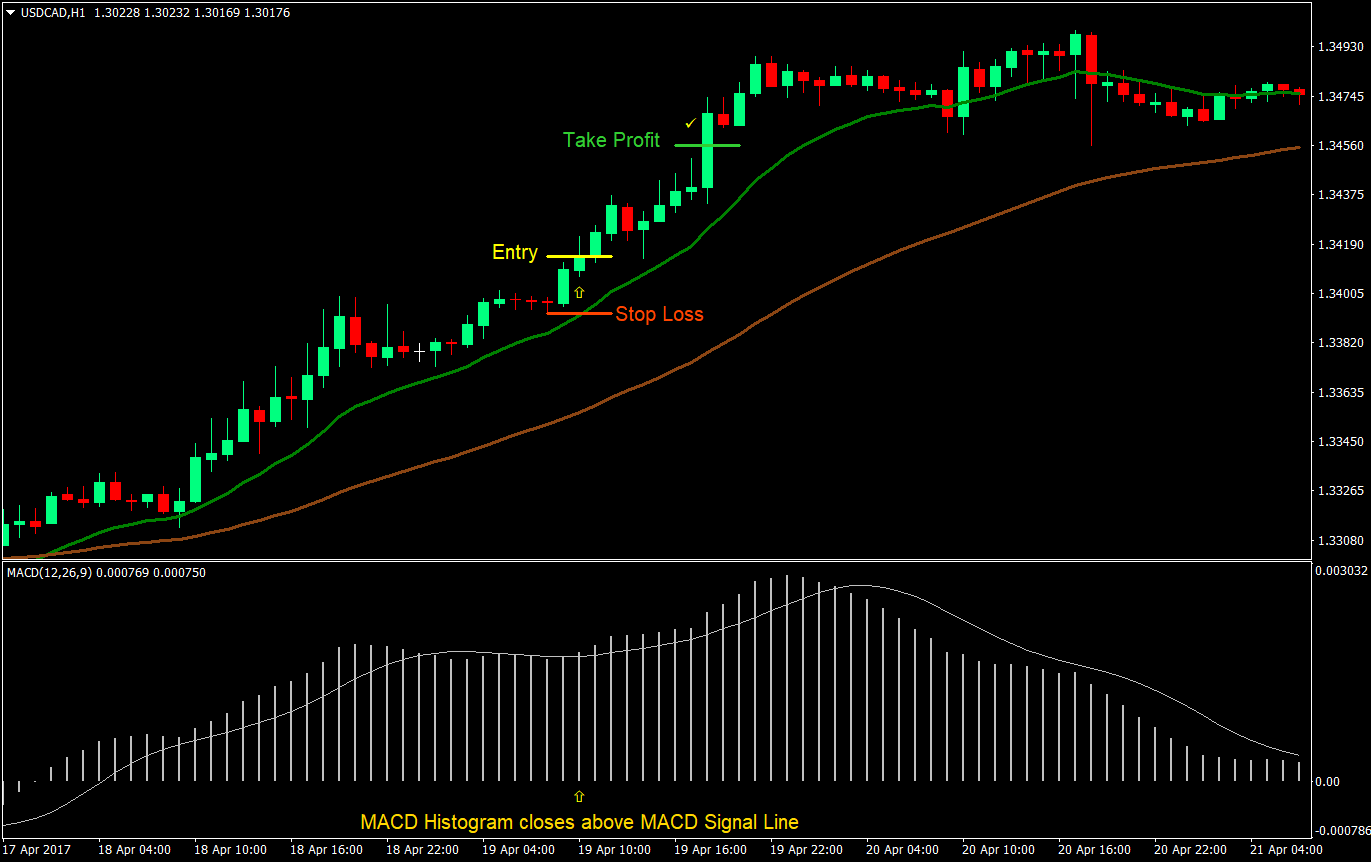
Our entries will be based on the crossovers of the MACD histogram and signal line. During an uptrend, the histogram is usually above the signal line. We then wait for the retracement or contraction as confirmed by the histogram going slightly below the signal line. Then finally, we enter the market as the histogram crosses above the signal line, confirming the end of the retracement.
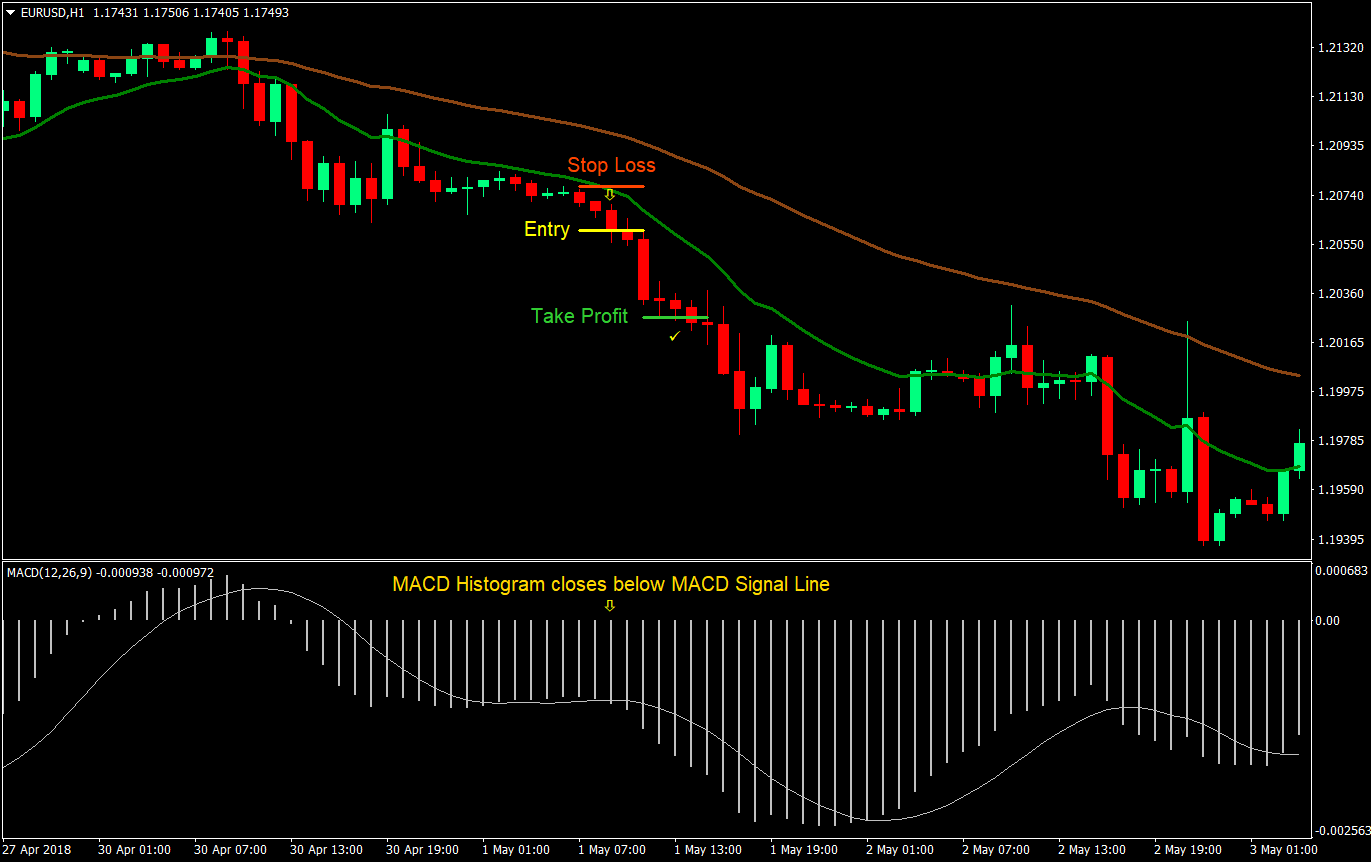
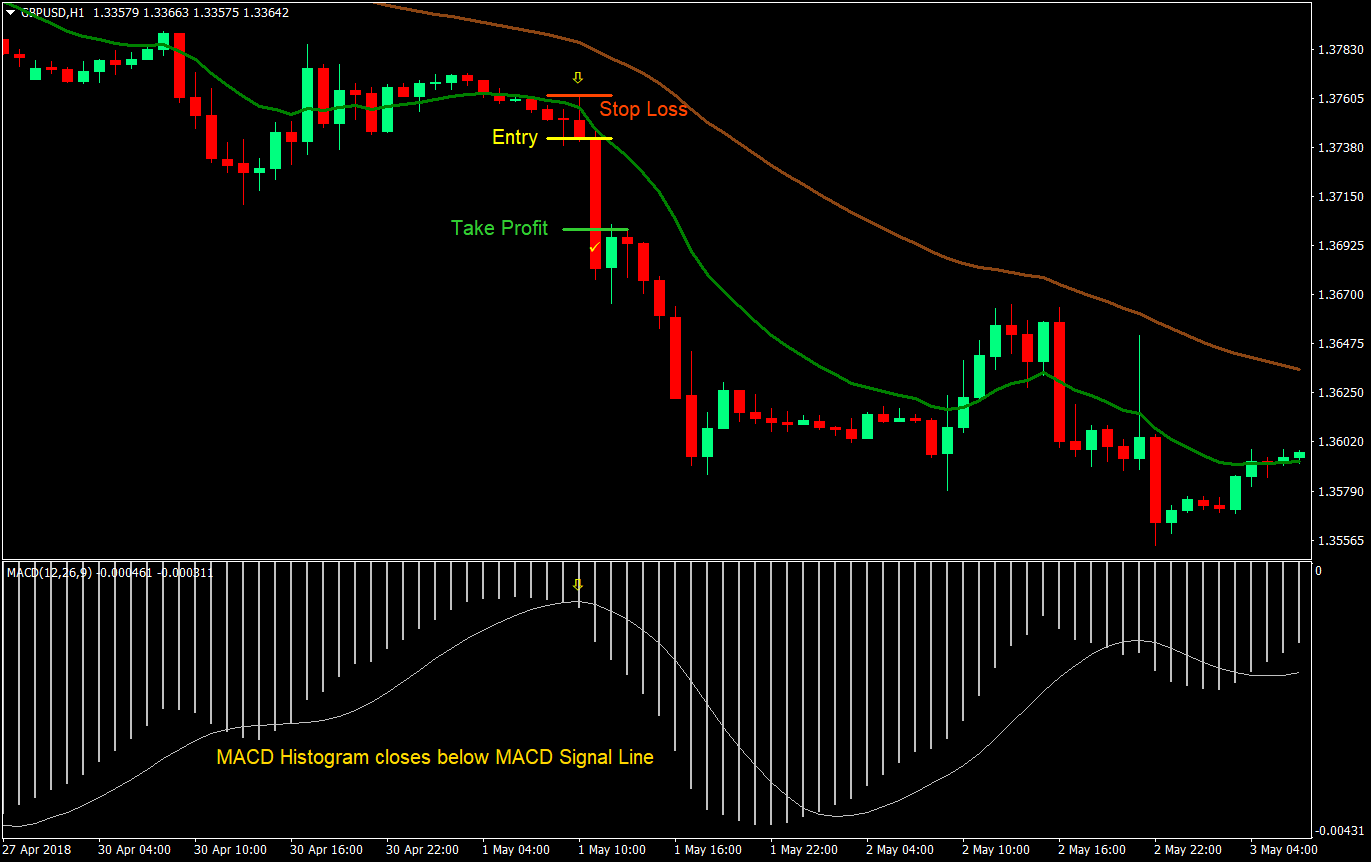
The opposite strategy applies for our sell trades.
Indicators:
- 14 EMA: Green
- 50 EMA: Brown
- MACD: default parameters
Timeframe: any
Trading Session: any
Buy (Long) Trade Setup Rules
Entry
- The 14 EMA should be above the 50 EMA
- MACD Histogram and Signal Line should be above zero
- Retracement: wait for the MACD Histogram to cross below the Signal Line
- Enter a buy market order as the MACD Histogram crosses back above the Signal Line
- Set the stop loss at the lowest low among the previous three candles and the entry candle
- Set the target take profit at 2x the risk


Sell (Short) Trade Setup Rules
Entry
- The 14 EMA should be below the 50 EMA
- MACD Histogram and Signal Line should be below zero
- Retracement: wait for the MACD Histogram to cross above the Signal Line
- Enter a buy market order as the MACD Histogram crosses back below the Signal Line
- Set the stop loss at the highest high among the previous three candles and the entry candle
- Set the target take profit at 2x the risk


Conclusion
This strategy is basically a typical retracement strategy. The only difference is that we are making use of the MACD to assist us in identifying the retracements.
If you have a background on pattern trading, you would notice that most of our entries are some form of continuation patterns, such as ascending or descending triangles, or flags and pennants. These patterns are typically found on a retracement, which is why they usually work as a continuation pattern. However, identifying these patterns on a naked chart would be a bit tricky.
By using the MACD retrace strategy, we are making it easier for us to identify these retraces. This is because the MACD histograms and signal line are responsive enough to crossover during retraces. Conveniently, breakouts and breakdowns of patterns also usually coincide with the crossing over of the MACD going back to the original trend direction.
Although this strategy does work, it is not perfect. There will be signals which wouldn’t work. You would have a hint of it not working out by looking out for contradicting signals such as reversal patterns on the price action, patterns such as double tops and bottoms. You could also observe for price action not making higher highs and lows or vice versa. Lastly, you could also observe divergences on the MACD, which may be pointing to the opposite direction.
Although this strategy is rules based, much of the decision is still discretionary because of the probable opposing signals. This means that it requires practice and screen time.
Back test it to develop that discretionary instinct and get in all that screen time.


