skrimon
Active Member
Forex charts are an essential tool for traders to make informed decisions and execute profitable trades. Reading forex charts might seem overwhelming to novice traders, but it becomes easier with practice and familiarity with the various charting tools and techniques.

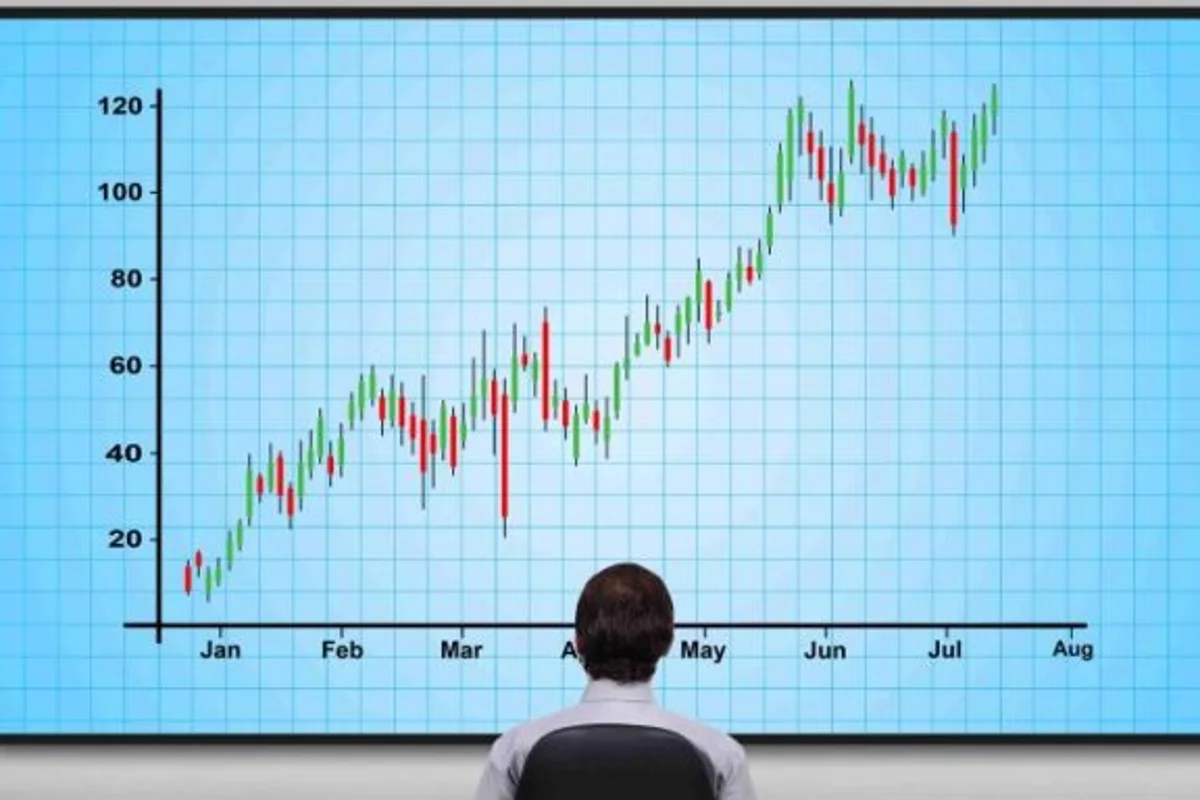
Forex charts represent the price movements of currency pairs over a specified period. The most commonly used type of chart in forex trading is the candlestick chart, which provides traders with detailed information about price movements.
Here is a step-by-step guide on how to read a forex chart:
- Currency Pair: The first step is to identify the currency pair you want to analyze. The currency pair is shown at the top of the chart, with the base currency on the left and the quote currency on the right.
- Timeframe: The next step is to choose a timeframe. Forex charts can be displayed in different timeframes, such as 1 minute, 5 minutes, 15 minutes, 1 hour, 4 hours, daily, weekly, and monthly.
- Candlesticks: The candlesticks on a forex chart represent the price movements of the currency pair over the chosen timeframe. Each candlestick consists of a body and two wicks. The body represents the opening and closing price of the currency pair, while the wicks represent the high and low prices.
- Colors: The color of the candlestick can indicate whether the price has gone up or down during the timeframe. A green or white candlestick indicates that the closing price was higher than the opening price, while a red or black candlestick indicates that the closing price was lower than the opening price.
- Support and Resistance Levels: Support and resistance levels are key levels on the chart where the price tends to stall or reverse. Support levels are below the current price, and resistance levels are above the current price. Traders use support and resistance levels to identify potential entry and exit points.
- Indicators: Forex charts can also include technical indicators, such as moving averages, Bollinger Bands, and Relative Strength Index (RSI). These indicators help traders to identify trends, momentum, and potential buy and sell signals.
- Volume: Volume is an important indicator that shows the level of market activity. High volume indicates that there is significant interest in the currency pair, while low volume indicates the opposite.
Forex charts are essential tools for traders to make informed decisions and execute profitable trades. By understanding the basics of how to read a forex chart, traders can gain valuable insights into market trends, support and resistance levels, technical indicators, and volume.


