Dominic Damoah
Active Member
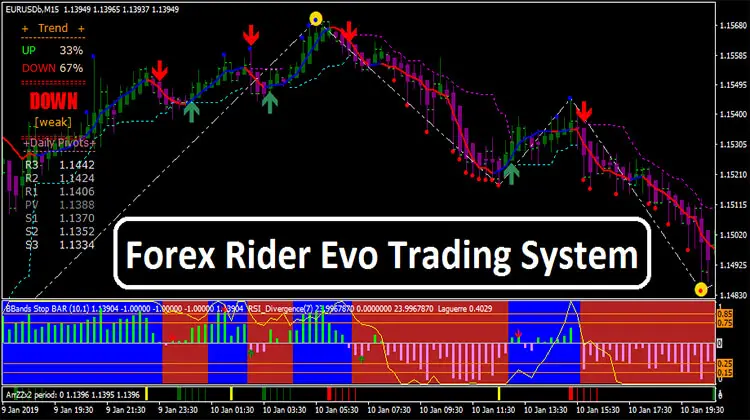
Forex Rider Evo Trading System has been developed with a combination of multiple forex indicators to form a trend following forex trading strategy. Besides generating trade signals, this system also displays details about market pivot levels, the trend status, and trade exit signals in order to guide its users all the way through each of their trade entry.
Forex Rider Evo Trading System can be applied to trade all kinds of forex currency pairs at the market. Moreover, this system suits all sorts of timeframe charts available at the forex MT4 trading platform.
After installing Forex Rider Evo Trading System at the MT4 terminal, your trading chart will appear like the following image:

FOREX RIDER EVO TRADING SYSTEM ANATOMY


Forex Rider Evo Trading System can be applied to trade all kinds of forex currency pairs at the market. Moreover, this system suits all sorts of timeframe charts available at the forex MT4 trading platform.
After installing Forex Rider Evo Trading System at the MT4 terminal, your trading chart will appear like the following image:

FOREX RIDER EVO TRADING SYSTEM ANATOMY

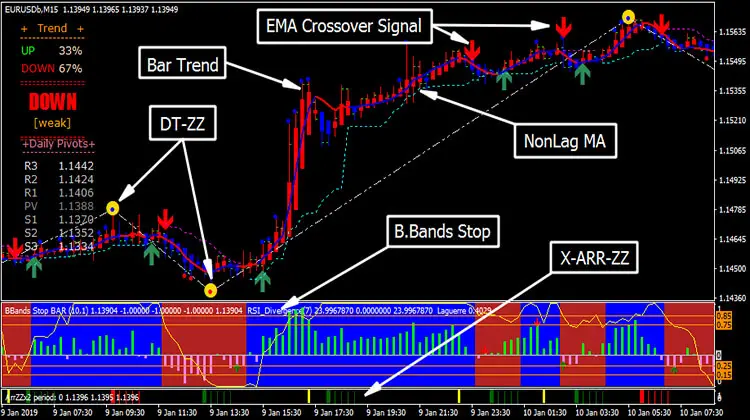
- EMA-Crossover Signal: Plots up/downward arrows to represent the Exponential Moving Average crossovers in order to identify the direction of the current trend. An upward arrow below the price bar means the bullish crossover and a downward arrow above the price bar is considered as the bearish crossover.
- Bar Trend: Forms as the main price bars to signal the market trend. It turns red when the trend is bullish and appears as blue to signal the bearish trend of the market.
- DT-ZZ: This indicator has been added to identify the possible swing level of the market. It helps traders to identify the potential market highs or lows so that traders can enter long from the bottom and short from the top of the market momentums.
- NonLag MA: It is a Moving Average which has been specially designed to react very quickly with the change in price actions thus redeems the lagging issues. It is blue when the trend is bullish and turns red to signal the bearish trend of the market.
- Bands Stop: Used to signal the current momentums of the market. Its value is positive means the momentum is bullish and turns negative to signal the bearish momentum of the market.
- X-ARR-ZZ: Works as a trend signal filter. It plots green bars to signal the validity of the bullish trend and red bars to certify the bearish thrust of the current market trend.

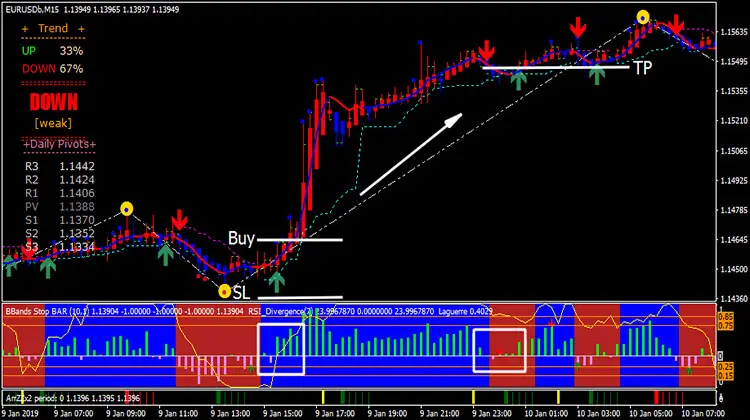
- Bar Trend turns red
- EMA-Crossover Signal plots upward arrows below the price bar
- NonLag MA turns blue
- DT-ZZ appears below the price bars
- Bands value turns positive
- X-ARR-ZZ plots green bars
- Buy triggers when the above conditions are met
- Set stop loss below the current DT-ZZ level
- Exit long/take profit whenever the EMA-Crossover signal plots a downward arrow above the price bar and B. Bands Stop value turns negative

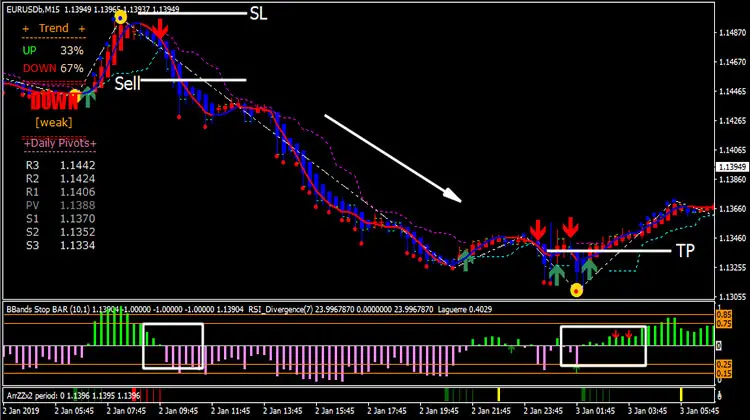
- Bar Trend turns blue
- EMA-Crossover Signal plots downward arrows above the price bar
- NonLag MA turns red
- DT-ZZ appears above the price bars
- Bands value turns negative
- X-ARR-ZZ plots red bars
- Sell triggers when the above conditions are met
- Set stop loss above the current DT-ZZ level
- Exit short/take profit whenever the EMA-Crossover signal plots an upward arrow below the price bar and B. Bands Stop value turns positive


 thanks Thank you for sharing pls keep us updated