5 Envelope Pin Bar Forex Trading Strategy
There are many indicators that are great to use and employ as a focal point of a strategy but are often overlooked by traders. Some indicators just seem to be popular while some just seem to lack appeal despite all its merits.
Today we will be looking at a strategy that combines the often-overlooked Envelopes indicator combined with a Pinbar custom indicator. These two elements combined makes up for an excellent short-term mean reversion strategy.
The Envelopes Indicator
The Envelopes indicator is a built-in indicator on most MT4 platforms. However, even though this indicator is available for use to most traders, only a few traders make use of this indicator.
Much like the Bollinger Bands, Keltner Channels, and Donchian Channels, the Envelopes indicator is a band-based trading indicator. However, due to the difference in how it computes for its midline and outer bands, it has characteristics that are quite different compared to the other band-based indicators.
The Envelopes indicator’s midline is typically based on a Simple Moving Average (SMA). However, the MT4 allows for the indicator’s midline to be modified. The moving average could be simple, smoothed, exponential, or weighted. It could also be applied to the close, open, high, low, median, weighted, or other configuration. Its outer bands are also based on the same moving average configuration as the midline, however it is shifted up and down based on a certain percentage of the midpoint.
Since, the envelopes indicator’s outer bands are not a totally different computation as the midpoint, but are instead just a shift of the center, the outer bands don’t expand or contract that much as the other banded indicators. It only appears to expand when the market is ranging but tends to contract when the market is trending.
Just as other indicators, many traders also interpret the Envelopes indicator differently. However, most traders see the Envelopes indicator as a trading range, with the area in between the outer bands as the range. Whenever price goes outside the bands, the market is presumed to be overextended. If price goes above the upper band, then the market is considered overbought and could be due for a reversal. If price is below the lower band, then the market is considered oversold.
The Pin Bar as an Entry Signal
The Pin Bar is a very popular candlestick pattern that many price action traders look at. It is very popular because it tends to be a high probability reversal pattern. It is a candlestick with a long wick one side, a small body, and a very small wick on the other end.
This candlestick is powerful because is signifies a change in market sentiment within one period or candle. Because of this characteristic, the pin bar tends to occur at the start of a reversal, giving it a high probability of an actual reversal.
The wicks also signify price rejection. Whenever traders see a pin bar pattern, many traders would be careful trading against it because price at the side of the long wick is usually considered a price that the market considers as an extreme.
Trading Strategy Concept
Combining these two concepts, the Envelopes indicator and a pin bar pattern allows us to take mean reversion trades on price extremes.
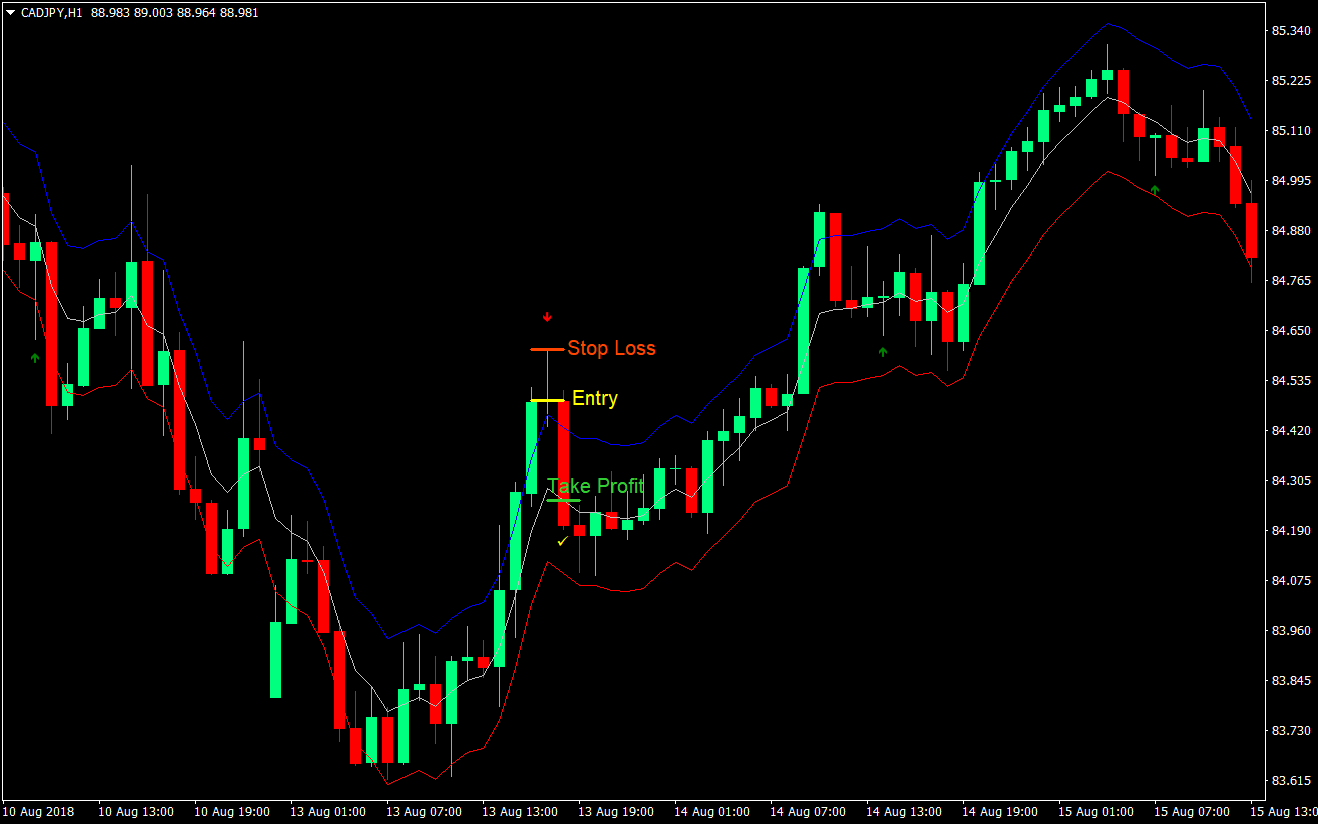
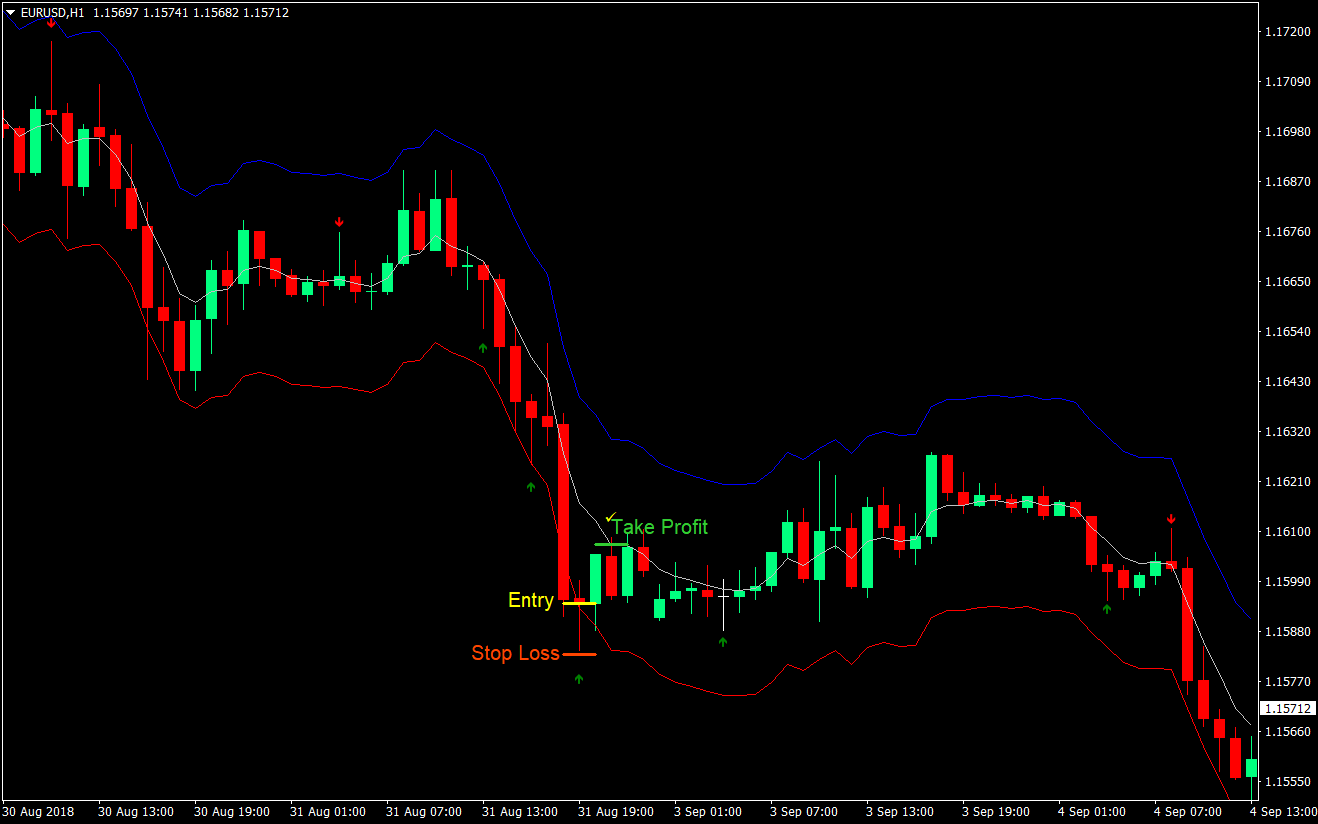
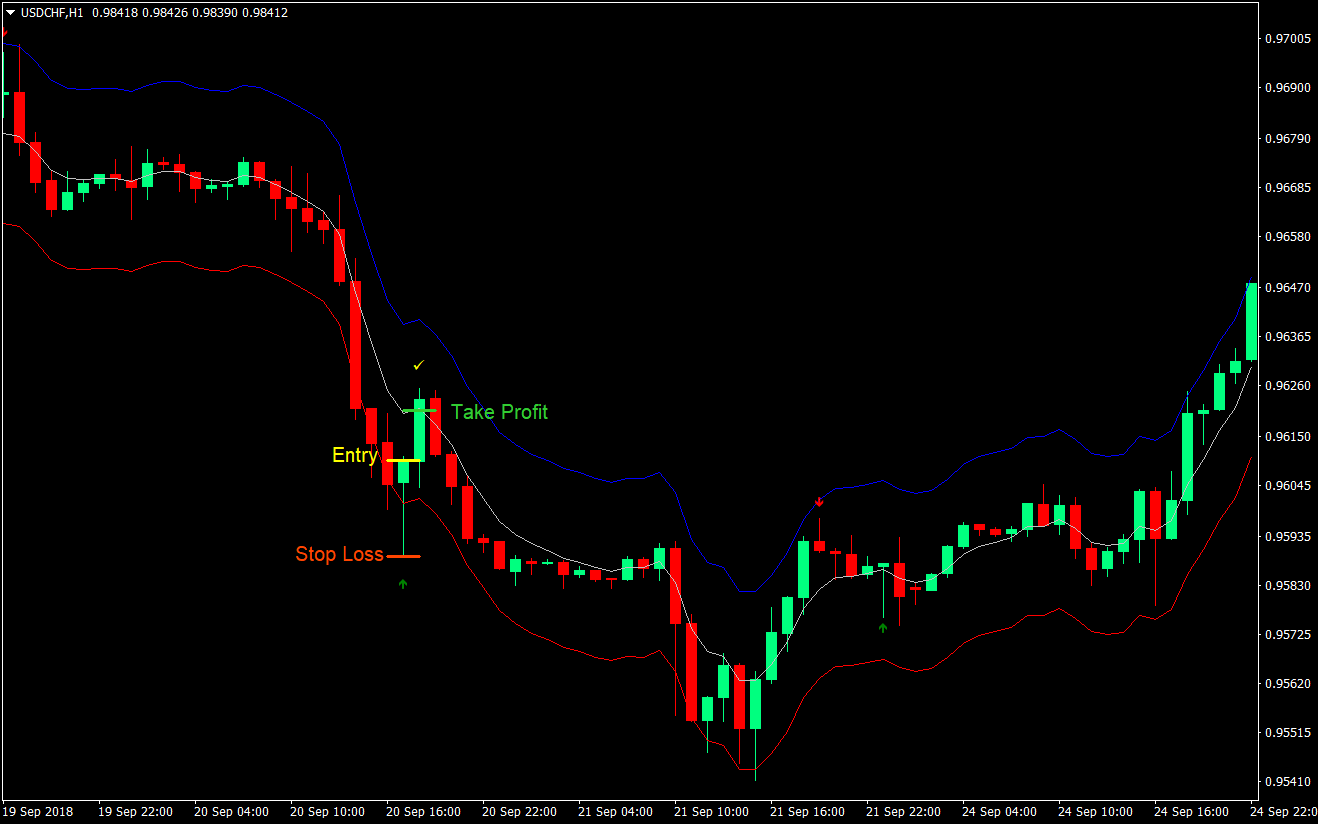
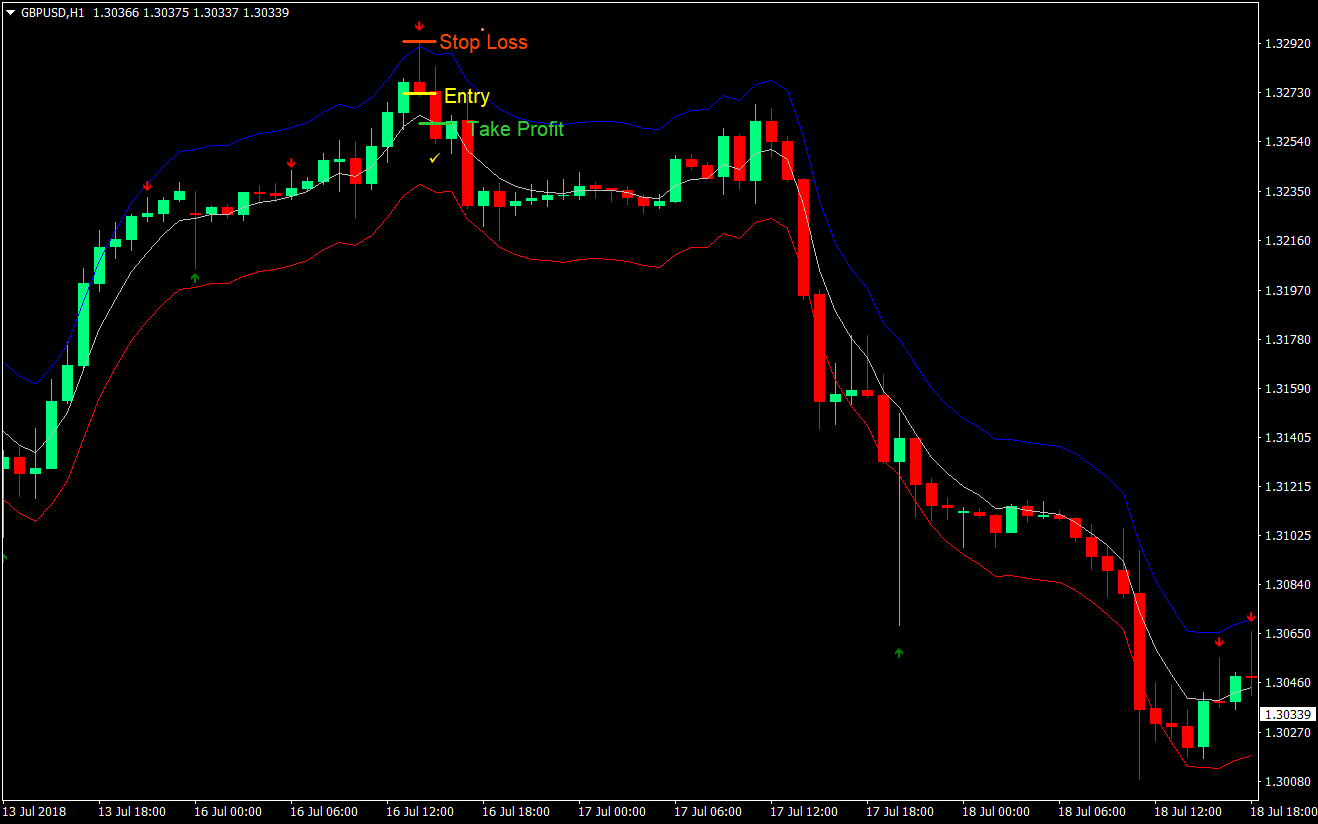
The Envelopes outer bands are considered the extremes. Whenever price goes over these lines, the market would be considered overextended. Then, if the next candle closes as a pin bar with the wick touching the outer band, then we would consider the rejection of price as confirmed. This gives us the signal to take the mean reversion trade.
However, because this type of mean reversion strategy typically goes against the short-term trend, we will only be aiming for the mean, based on the Envelopes’ midline.
- Indicators
- Envelopes
- MA method: exponential
- Period: 5
- Apply to: close
- Deviation: 0.20%
- Pinbar
- Envelopes
- Timeframe: 1-hour chart only
- Currency Pair: any
- Trading Session: Tokyo, London, New York
Entry
- Price must touch or go below the lower band signifying that the market could be oversold
- Wait for the Pinbar indicator to print an upward arrow signaling a bullish pin bar pattern
- Enter a buy market order at the close of the pin bar pattern
- Place the stop loss immediately below the entry candle
- Close the trade as soon as price touches the midline of the Envelopes indicator


Sell (Short) Trade Setup
Entry
- Price must touch or go above the upper band signifying that the market could be overbought
- Wait for the Pinbar indicator to print a downward arrow signaling a bearish pin bar pattern
- Enter a sell market order at the close of the pin bar pattern
- Place the stop loss immediately above the entry candle
- Close the trade as soon as price touches the midline of the Envelopes indicator


Conclusion
This strategy is an effective mean reversion strategy. It tells us when the market is prime for a reversal based on the outer bands, it tells us when to take the trade using the Pinbar indicator, and it shows us where to exit the trade using the midline of the Envelopes indicator.
This strategy however is not a high reward-risk ratio strategy. This is typical of most mean reversion strategy. Because of this, you would have to filter out trades that have a very low reward-risk ratio. These are pin bar patterns that close near the midline, giving price little room to move for us to profit from. In many cases, price could also cross the midline going near the other outer band. You could exit the trade as price crosses. This tweaking would be up to you.


